


The Hydrino Hypothesis Chapter 8
An Introduction To The Grand Unified Theory Of Classical Physics

This monograph is an introduction to Randell L. Mills’ Grand Unified Theory of Classical Physics, Hydrino science, and the efforts of the company Brilliant Light Power (BLP) to commercialize Hydrino-based power technology, as told by Professor Jonathan Phillips. Out of necessity, it assumes a degree of familiarity with physics and physics history. An overview of the BLP story which serves as a helpful introductory piece to those unfamiliar with its sweeping scope can be found here. Readers should also read the previous chapters of this monograph prior to this one:
Chapter 1 of The Hydrino Hypothesis
Chapter 2 of The Hydrino Hypothesis
Chapter 3 of The Hydrino Hypothesis
Chapter 4 of The Hydrino Hypothesis
Chapter 5 of The Hydrino Hypothesis
Chapter 6 of The Hydrino Hypothesis
Chapter 7 of The Hydrino Hypothesis
By Professor Jonathan Phillips
Experimental Evidence For Hydrino: Balmer Line Broadening
Preface: This chapter is an introduction to experimental studies designed to debunk the Hydrino Hypothesis (HH) component of the GUTCP, specifically line broadening of hydrogen spectroscopic lines. Also reviewed are those studies that were carried out on the same phenomena for non-HH purposes, that is, experiments not designed to debunk HH, yet effectively serve, accidentally, as tests of the HH. Numerous reports from laboratories around the world of spectroscopically observed anomalous Balmer series line broadening in plasmas of all types, as well as Balmer line broadening observed in stars, are reviewed. Line broadening was observed only in Hydrino-catalytic plasmas, including the (catalytic) plasmas of stars, as predicted by the HH model. Finally, it must be noted this is not intended to be an exhaustive survey of experimental studies that fail to debunk the HH. In the next chapter, EUV spectroscopy is reviewed, and in the Chapter 10 calorimetric work is reviewed, (an area of expertise for this author), but a thorough review of HH tests conducted using other techniques (e.g. nuclear magnetic resonance (NMR) and electron paramagnetic resonance (EPR)) is left (mostly) to those more expert.
INTRODUCTION
In Chapters 3-6, the application of the GUTCP to the known data for accepted forms of atoms and ions was reviewed. All was found to be in order per GUTCP predictions. Using simple force balances, no adjustable parameters, the GUTCP was able to provide quantitative predictions regarding quantized energy levels in all species that agreed with measurement, generally with a difference of order 1 percent or less.
In contrast, it was shown SQM is merely a very complicated, non-physical, curve-fitting method. Even the various extreme SQM approximations (dropping dimensions, mathematical gibberish to “approximate” infinities, allowing electrons to be distinguishable, correlation, no magnetic term in the energy equation, etc) can only be employed to determine the value of adjustable parameters that provide the closest approach to the experimental data. It was concluded SQM is not a viable theory of atoms and ions, but the GUTCP survived all efforts to debunk it and remains viable, and in fact, highly likely to be correct.
In sum, as argued in Chapters 3-6, the GUTCP model is currently the only viable model of known forms of atoms and ions, but are the predictions of the GUTCP for a completely unknown form of matter, the Hydrino (per Ch. 7), correct? Indeed, this is key to determining if harnessing the production of energy from Hydrino formation, the primary goal of BLP, is a Sisyphean pursuit, or a realistic enterprise.
In the preceding chapter, we saw the advancement of the Hydrino Hypothesis (HH) by the GUTCP. Specifically: the orbitsphere electrons of a hydrogen atoms can shrink in a two-stage process to quantized smaller, stable orbitspheres (136 sizes/energies) called Hydrinos. The process of shrinkage releases energy in distinct forms for each of the two steps.
The prediction of particular relevance to this chapter regards one type of “signal” predicted to exist as an indication that Step I of the process, formation of a hydrogen “transition” state, occurs. The process of transition state formation, according to the GUTCP, requires a catalytic species. The catalytic species absorbs the energy lost by the standard ground state hydrogen atom during the formation of the transition state; hence the catalyst becomes very energetic.
Testing the paradigm shifting (and hence panned by the physics establishment) HH hypothesis is the only scientifically acceptable path forward.
Those scientists advocating for dismissal of a proper investigation, or even an open discussion, of the HH are ignoring the credibility factor: all the GUTCP is credible because the model produces remarkable quantitative agreement with experimental measures of the ionization energies, excitation states, etc. for atoms and ions using only classical physics equations. Given this credibility of the GUTCP’s predictions, the possible existence of the Hydrino, as predicted by the GUTCP, cannot be summarily dismissed on any scientific or logical basis.
How to test the HH is a puzzle. The scientific process for theory testing (Chapter 2) requires not that a theory be proved, but rather that experimental efforts designed to disprove that theory should be conducted. One method for following the scientific approach is that applied to distinguish which of two competing theories is possibly correct: design and conduct an experiment the outcome of which can only be consistent with one or the other theories, but not both. Such an experiment can destroy the viability of one theory, show the other theory remains viable, and boost the likelihood that the still-viable theory is correct.
It might appear that simply capturing Hydrinos in a bottle and handing that bottle to experts to analyze should be simple. Imagine: Super Duper Test Lab Inc. is sent a sample by BLP to test for Hydrinos. Super Duper sends back an urgent message: “yes, there were three moles of Hydrino in your sample!”
Stop the dream! It’s not so simple. There is no lab advertising the ability to test for Hydrinos. There are no Hydrino detectors and no National Institute of Technology (NIST) protocols for measuring and counting Hydrinos. Instead, to test the HH, new and clever experiments have been devised and conducted.
The experiments described in this chapter are primarily based on a model of the catalytic process for Step I of Hydrino formation. In the following chapter tests and results of tests for demonstrating the existence of Step II of Hydrino formation are explored.
The tests explored for demonstrating the existence of a Step I process are based on searching for extremely hot H atoms, which are predicted by the HH to exist after Step I catalytic processes. It may also be the case that fast H is the result of Step II of the Hydrino formation process; Dr. Mills contends that the energy released as hydrogen transitions into the Hydrino state may be released as third body kinetic energy under certain conditions, although this mechanism is not well developed and will not be the primary focus of this chapter.
The GUTCP-predicted spectroscopic “signal” created by these catalyst routes (and other mechanisms) will be a type of Doppler phase shift. Specifically, the Balmer series lines of H atoms formed by the H2 or H2O molecule catalyst during the Step I process are predicted to be extraordinarily broadened. Not only will these lines be broadened but broadened to a specific extent. Indeed, the kinetic energy of the H atoms formed will be quantized, corresponding to the energy lost by the H atom moving to a transition state. In sum, the HH predicts during Hydrino formation superhot H atoms will be generated, and consequently Balmer series spectroscopic lines of unprecedented broadening will be observed, corresponding to unprecedented energies, energies in great excess relative to all other species in the plasma.
The finding of super-hot H in certain plasmas, as predicted by the GUTCP, will be a powerful “validation.” All other explanations for super-hot H atoms fall flat, as described later, both experimentally and theoretically. Conversely, failure to observe superhot H atoms in terrestrial experiments, or in stars, would deliver a severe blow to the GUTCP model. However, no such failure is observed. The GUTCP remains valid.
Only the GUTCP provides a predicted route, as well as a predicted set of plasmas, in which these super-hot H atoms should be found. At a minimum, finding super-hot H atoms only in plasmas containing identified HH catalysts fails to debunk the HH.
It could be argued that these are only indirect tests. Indeed, the actual observation of transition states or Hydrinos is not an object of the tests. This is not a strong argument. There is nothing unusual with an indirect approach to testing a theory in physics. Most physics experiments are indirect. Has anyone actually examined a single electron, particularly the infinitely small version of SQM? How about a Higgs Boson? The data for the Higgs boson is very indirect, and hardly compelling. At best it should be considered as a weak failure to disprove.
Clearly, indirect experiments cannot prove the existence of any species, but they can fail to disprove, hence increasing the likelihood a postulate is correct. Dark matter? Dark energy? Are they available on Amazon?
In this chapter, only the results of studies of Balmer line broadening in plasmas, both terrestrial and in stars, are reviewed. This particular topic was selected for extensive review because this author has established, via publishing and patents, very credible expertise.
Conclusion: the HH remains a valid model, alternative models of the phenomenon fail and hence are debunked.
Balmer Series Line Broadening in Select Hydrogen Plasmas
Balmer series line broadening is reviewed in detail because the GUTCP Theory of Hydrino formation predicts that the process of Hydrino formation will result in the production of some superheated hydrogen atoms through a process called Resonant Transfer (RT).1234
That is, the RT process predicts that electrons in atomic hydrogen may change energy state via a physical collision process with a catalyst, without the involvement of photons. In particular, the theory predicts that plasmas containing hydrogen and an identified gas phase catalytic species will create Hydrinos and also super-hot hydrogen atoms zipping about with some multiple of ~27.2 eV (minus the binding energy of hydrogen molecules) of energy. We refer to these plasmas as RT plasmas.
How will this special feature of RT plasmas, super-hot excited H-atoms, be exhibited?
Evidence will be found in the shape of the spectral lines of hydrogen. It is well established that plasmas containing hydrogen will generate Balmer (N=3,4,5… to N=2) and Lyman (N=2,3,4…to N=1) series spectral lines, but RT theory predicts an additional feature of the spectral lines.
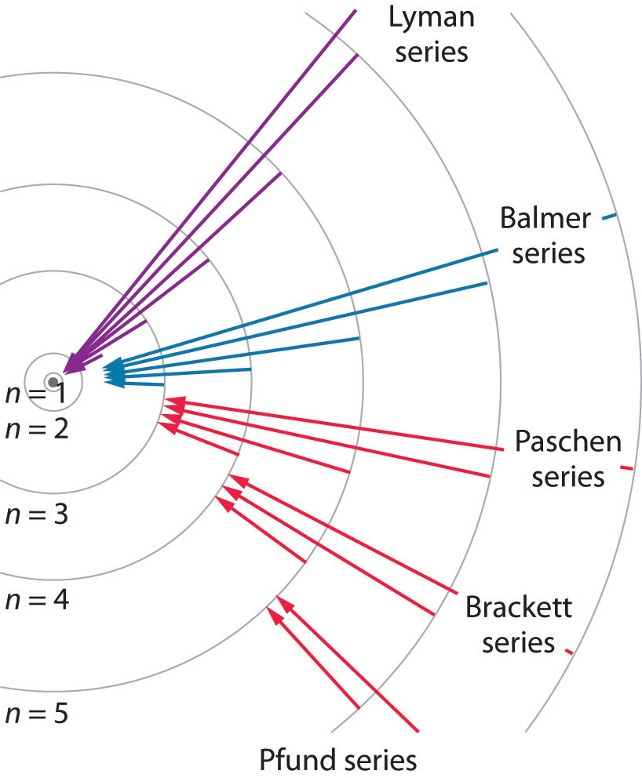
Figure 8-1: Spectroscopic lines of excited state hydrogen- Hydrogen may absorb photons and transition to different orbits (N=2,3,4,5…etc). Light of specific wavelengths are released as the excited state hydrogen transitions from a higher energy state to a lower energy state. For example, when a hydrogen atom transitions from the N=5 state to the N=2 state (part of the Balmer series), it emits a photon with an energy equal to the difference in energy between these two states.
Specifically, that those hydrogen atoms that undergo the RT process are super-hot, that is an order of magnitude hotter or more than any other species in the plasma, due to energy transfer associated with the RT process of Hydrino formation. Hence, it is a prediction of the RT model that there will be Doppler Broadening of the Balmer series spectral lines everywhere in plasmas in which both hydrogen and a gas phase Hydrino catalytic species are present. Specifically, this broadening should reflect an energy of m*27.2 eV, minus energy required to maintain momentum balance, break bonds, etc. where m is a natural number less than 137.
The HH also predicts the process of creating the high energy hydrogen atoms is “chemical” (in that it is electron-mediated) and not “field generated,” thus there should be no preferred direction relative to the direction of the applied electric field. In turn, if true, the observed Doppler broadened lines, from any perspective relative to that field, should be identical and symmetric in shape.
Familiar analogy: the Doppler shifted sound produced by car horns from cars moving with equal speed toward (higher frequency), and away (lower frequency), from an observer sitting in the middle of an intersection. If the number of cars approaching and leaving are equal, the observed sound frequency spectra will be symmetric around the frequency of no sound shift.
To summarize the above, the RT theory PREDICTS this line broadening should be consistent with these rules:
Balmer line broadening should be observed only in plasmas of Hydrino catalytic mixtures, particularly pure hydrogen, H2/He, H2/Ar, and pure water plasmas.
Balmer broadening should not be observed in most other plasmas (e.g. H2/Xe, H2/Kr).
Balmer broadening in all plasmas should be independent of angle of observation relative to any applied field in the plasma.
Balmer broadening should be observed throughout the plasma, even in low field regions.
Balmer broadening should be observed in plasmas generated with direct current, RF and microwave.
The HH clearly provides detailed predictions regarding Balmer line broadening in plasmas, hence a lot of opportunity for the physics community to design experiments to test/debunk GUTCP. Indeed, a considerable amount of effort has gone into debunking the hypothesized RT process and thus the HH on the basis of line broadening outcomes alleged to be contrary to the RT process predictions.
Balmer broadening in plasmas is regularly observed by labs adhering to standard paradigms, including SQM. That is, Balmer line broadening in plasmas, and the inference of the existence of super hot H atoms, is widely accepted by the “we-ignore-the-GUTCP” community. In other words, the observation of the line broadening itself is not controversial.
The most frequently provided explanation for this well-documented existence of Balmer line broadening by these conventional doctrine supporting labs are a family of models in which line broadening is created by high electric field acceleration (FA models) of H+ ions in plasmas. Crucially, this explanation requires the presence of strong electric fields.
In the following it will be shown this model family of line broadening is never truly tested by the mainstream. Rather it is clearly a set of related ad hoc models (no math) put forward by experts (?), hence presumably “true by authority.” A smaller number of scientists attribute the observed Balmer series line broadening to other effects. These models also fail to be upheld by experiment.
In sum, the data on Balmer series line broadening is thoroughly vetted below, and it is shown that the FA models, as well as some other models, are clearly debunked and only the RT/HH model remains validated.
A: Observation of Balmer Line Broadening In Other People’s Data (OPD)
As reviewed in the literature before 2008 (Ref. 8-4), there were more than fifteen published reports of line Balmer Series broadening in RF and DC plasmas carried out by independent investigators with no connection with BLP.
All results from these independent investigators were consistent with the above list of requirements: the observed Doppler broadening was symmetric, and where measured, the line broadening was reflective of H atoms >25 eV hotter than all other species in the plasma, and it was regularly observed that the effect was strongest when a Type I Hydrino catalyst was present, etc.
Thus, OPD experiments on Balmer line broadening in RT plasmas from independent investigators contains no debunking of RT/HH.
However, it must be noted these studies were not thorough and failed to collect data that might confirm/debunk either the FA or RT models. For example, they did not look for Balmer line broadening outside the high field regions, and generally did not look for broadening in anything other than H2/Ar and pure H2 plasmas.
Field Acceleration Model
The reports from independent investigators, discussed below, failed to debunk the HH, but these workers generally did not employ, or generally acknowledge, the RT/HH model in their explanations.
Instead, they explained the observation using a family of FA models. Why super-hot H atoms? All agree only such atoms can produce the Doppler broadening of all the hydrogen spectral lines as observed in many plasmas, particularly H2/Ar plasmas.
The FA models are all complex and multi-step. All are based on variations on this three-step mechanism for hot H atom production in the high field region of a terrestrial plasma:
Field acceleration of ionic H species (generally H+), necessary as neutral atoms and molecules will not be accelerated by an electric field. Only charged species, generally about 1 in 10,000 atoms in a plasma (more later), feel a force from an electric field.
Electron capture due to collision with argon or hydrogen. This step is necessary because the only ion that hydrogen forms is a bare proton. Bare protons do not have electrons, hence cannot produce the Balmer series of line produced when an electron in an excited state (n=3,4,5) falls via natural process, into a lower energy state (Balmer Series final state, n=2).
Finally, the super-fast (Step 1), recently formed (Step 2) excited hydrogen atom emits a Doppler shifted Balmer series line as the electron initially in a n>2 state falls to the n=2 state.
A complicated dance in a very small place and short time.
Like the HH Type II catalyst model, the FA model, all agree, should produce definitive and observable outcomes; moreover, the same tests, as noted earlier, are predicted to produce different outcomes according to the RT model. The predicted outcomes for the two models from four tests are summarized below.
Test One: There should be a distinct, totally distinguishable, orientation effects for each model (Ref. 8-4)
FA orientation effect prediction: viewed from a position perpendicular to the direction of electric field the average Doppler broadening should be dramatically less than that observed along an axis parallel to the field. Why? There is no field acceleration of charged species perpendicular to the applied field.
RT orientation effect prediction: there should be zero orientation effect. Orientation relative to an electric field plays no role in the RT model.
Test Two: Broadening should be a function of the gas composition of any plasma which contains hydrogen
FA gas composition effect prediction: the composition of the plasma should have no effect as long as the plasma contains hydrogen. The FA model indicates broadening is not a function of anything but field acceleration.
RT gas composition effect prediction: only pure hydrogen or plasmas containing hydrogen and catalytic species (e.g. Ar, He, H2O) should lead to Balmer series line broadening. Mixed plasmas that do not contain catalytic species, such as H2/Kr and H2/Ne, should not show broadened Balmer series lines.
Test Three: Is broadening a function of the electric field strength?
FA field strength prediction: the observed behavior effect should only be observed in high field regions. Clearly, there is no acceleration of ions where there is no field.
RT field strength prediction: line broadening of consistent magnitude should be observed throughout a plasma, in regions of no field and regions of high field. The catalytic process is not electric field dependent. In the non-field regions, it is expected there will be fewer H atoms, hence the line intensity, but not line width, is expected to drop away from the high field H atom source.
Test Four: Is the field observed in microwave plasmas?
FA model of broadening in a microwave plasma: the effect should never be observed in a microwave system because ions are too heavy to follow the field, and thus gain energy at microwave frequencies. Only electrons absorb energy from the field and become hot at microwave frequencies.
RT model of broadening in a microwave plasma: as long as the plasma contains H atoms and Hydrino catalytic species, broadening should be observed; hence, broadening is anticipated in DC discharges, RF plasmas, and microwave plasmas.
Unfortunately, the independent investigators did little work to apply the above tests of the FA models. It appears that those conducting the work were either unwilling to put the model to serious test or were so confident in the FA model that they felt no need to make those tests required by the proper scientific method.
Remarkably, those few tests (below) conducted by independent groups contradict the above FA model requirements. Some of this is briefly reviewed herein, and more detailed analysis is available elsewhere (Ref. 8-4).
Detailed Review of a Letter to the Editor
There are many studies, generally supportive of the FA models, from independent labs. Where to start a detailed review?
Herein we begin with the most “open” intersection of the FA and RT model communities.
Specifically, below is a detailed discussion regarding a Letter to the Editor published in the Journal of Applied Physics directing a “withering” attack on an article on calorimetry (to be discussed in Chapter 10) supporting the RT model.5
Another reason for starting with this critique: it is exemplary of the distortion of science to pursue not truth, but rather agreement with narrative.
Notably/oddly and exemplary of the entire line broadening “debate,” there was no mention of line broadening in the calorimeter paper. This did not prevent the author of the critique making an almost immediately pivot, virtually the entire letter, to an attack on other literature, specifically Balmer line broadening studies by BLP-related teams.
The following evaluation of the claims therein are based on the results of the four Tests listed above. Remarkably, the literature cited in this critique is totally inconsistent with the claim put forward in the critique that there is specific line broadening data in the literature that debunks the RT model.
Test I results from the literature cited in the critique:6
the equality of Ha line broadening both parallel and perpendicular to the applied field is “..indirect evidence in favor of the existence of isotropic velocity distributions…”
That is, all evidence, all plasmas studied (H2 and Ne, H2 and Kr, H2 and Ar) showed no preferential line broadening parallel to the applied field. Any observed broadening was direction independent (isotropic). This finding is consistent with the RT predictions. To make this observation consistent with the FA models requires a complex and twisted explanation.
Test II results show more broadening in plasmas containing catalyst species.7 Unfortunately, it is not possible to report details from the data because no details are given. Possibly, the authors of these studies found the Kr and Ne based plasma broadening so inferior to that observed in pure H2 and H2/Ar plasmas that details were deemed unimportant. Hence, only the qualitative comments are reported:
“As compared to the H2 + Ar mixture, H2 + Kr has lower total brightness of spectral lines and a lower brightness of far wings…”
Contrary to the statement in the critique, there is no clear, reported evidence that in a H2/Kr based plasma (Kr is not a predicted Hydrino catalyst), Balmer series line broadening is as significant as in a H2/Ar plasma, or other RT (catalyst containing) plasmas.
The evidence for a lack of equivalent broadening for a non-Hydrino catalyst plasma is found for H2/Ne plasmas (Table 8-1). As predicted by the RT model, the measured broadening is consistently lower than that found in an equivalent system generated with pure hydrogen. (Also, as discussed in the Author’s Concerns section, there is some reason to believe Ne may have weak Type I catalyst properties.)

Test III: there was no Test III. The third test for distinguishing between the RT and FA models, measuring broadening outside the high field region, was not conducted. No data was collected outside the high field region.
Test IV: all work was done in a DC discharge, with no RF or microwave data available.
In sum, there is no data presented in the literature cited in the Critique that is inconsistent with the predictions of the RT model, but a lot of evidence that requires complex explanations to maintain the data is consistent with the FA models. The RT models remain valid, but the FA model is limping badly, at best.
Review of Data for Bounce Component of the FA Model
The FA models, including that cited by the authors of data in Table 8-1, require fast H atoms to “bounce” off the electrode. Why bounce?
To explain the observed symmetry of broadened Balmer lines observed in all plasmas, including the DC plasmas generally studied, the FA model requires the fast H atoms bounce off the electrode. Without the bounce the lines will not be symmetric in the FA model, and instead will be non-Gaussian in shape.
Why? From a spectrometer looking toward the negative electrode, the atoms going toward the electrode will have a Doppler shift toward shorter wave lengths, and those that bounce and come back toward the observer will have an opposite Doppler shift; toward the longer wavelengths, resulting in a symmetric broadening profile.
In sum, the FA models all contain some version of this bounce postulate: fast H bounces off the electrode with no loss of energy. Moreover, bouncing effectiveness is a function of the material composing the negative electrode (see Table 8-1, different electrode materials).
There are several categories of problems with the bounce model and data.
First, there are fundamental issues with the bounce model. One: is the postulate that excited H atoms will rebound at all from electrodes plausible? For reference, consider bounce relative to the reactive ion etching process used in the production of semi-conductors. In that process, super-fast ions, definitively generated with an electric field, don’t bounce, but rather etch the surface by knocking surface atoms out into the plasma.
Second, what will the resulting Balmer series lines look like? Will a single symmetrical line be observed? Or, is it more likely there will be two lines, one shifted to a shorter wavelength and one to a higher wavelength, with a trough between at the standard, unshifted wavelength? The Gaussian profile of the Balmer line, as observed, is only anticipated if a full broad range of velocities is anticipated. Yet, in the bounce model there are supposedly two distinct populations of H atoms at exactly two distinct velocities.
Third, is there a real basis for different style bounces off different materials?
In any event, these issues have not been pursued in this treatise as such an effort would lead to murky gray areas and unending arguments. Instead, the focus of the review will be on a related issue: the quality of data presented to support the existence of electrode-bouncing-super-fast-H.
In particular, there is overwhelming evidence that the spectroscopic equipment employed was simply not adequately sensitive to demonstrate a material-related rebound effect. In fact, as the authors (Phelps et al., e.g. Ref. 8-8 and 8-9 and references therein) stress, the spectroscopy equipment is the same as that employed in all their studies, which suggests an underlying pathology that makes all their studies and models of aspects of fast hydrogen suspect.89
How evident is it that the instrumentation was inadequate? The data from a standard hydrogen source tells the tale. In one of the few FA studies related to the bounce hypothesis, a standard hydrogen lamp was employed to calibrate/demonstrate the equipment (Ref 8-8). Unfortunately, as shown by the measured Full-Width Half Maximum (FWHM) of the hydrogen line from the lamp, they report a line width of a control hydrogen that is more than 100 eV, as shown in Figure 8-1. This FA measure from a standard hydrogen lamp (Figure 8-2 below) is LARGER than the largest measured RT-generated line broadening (~80 eV) reported in the LANL/UNM RT debunking studies.
In contrast, all the spectrometers employed by the various BLP-related laboratories (Refs. 8-1, 8-2, 8-3) can show un-excited hydrogen lines that are less than 1 eV in energy width. This difference probably stems from the reported sensitivities of the equipment employed. Phelps et al. report spectral resolution over a variable range of 0.2 to 1.4 nm. In contrast, the Phillips LANL/UNM team (below) employed a 1.2 meter Jvon Spex instrument with a reported, and demonstrated, resolution of about 0.01 nm.
Even someone not familiar with spectroscopic data can readily observe in Figure 8-2 some irregularity in the data points to which the spectral lines are fit. This clearly indicates the signal/noise ratio is unacceptable for this type of analysis. Also, why are the lines fit such that on one side of “0” they are to the “right” of the data and on the other side, to the “left” of the data? It could be argued that fit “inadvertently” favors the preferred model.

Figure 8-2: Inadequate Sensitivity- Reported Ha lines from DC discharge plasma. The (blue) line from a standard H2 lamp is approximately 0.5 nm FWHM. This is extremely broad, and inadequate in sensitivity to determine line broadening with any precision. In contrast, the author of this treatise employed a spectrometer with greater than 10 times the resolution. (From Ref 8-8)
In addition to questioning the spectroscopy on a quality of instrumentation basis, as per the above arguments, there is also a plausibility failure. There are specifically two features of the data and the models which are inconsistent with all studies of plasmas.
First, as repeatedly observed, even with the best reactive sputtering tools, DC plasmas generally contain greater than 99.9% neutral species and no more than 0.1% ions.1011 Thus, according to the FA models the Balmer series lines should be dominated by the narrow lines of the neutral hydrogen atoms.
Clearly, as shown in Figure 8-4 below, all the Balmer Ha (H alpha is the name of first of the Balmer series, emitted when hydrogen in an N=3 state falls to N=2) line is alleged to be from an accelerated ionic species. There is no ordinary, unbroadened, Ha line at all. Why aren’t the lines compound, showing both HOT and ambient plasma temperature H atom type behavior?
The second plausibility issue is the purported unique temperature profile of the ions in the plasma. In all reports, the temperature of the ions in a DC-type plasma decays exponentially, such that ~90 % of the ions have an energy no more than 15% of the applied voltage, and 99% have an energy lower than 30% of the applied voltage. Only 0.01 % attain the applied voltage. Is this well-known trend consistent with the data in the FA model study? From Fig 8-2 the Ha line FWHM from the 380 V data is ~150 eV. Less than 1% of all ions are expected to reach that energy level, 150 eV, in a DC discharge plasma operated at 380 V.
Thus, it appears this high energy 1% is overrepresented in the observed line. Herein this “overrepresentation” of high energy species is an artifact attributed to the inadequate spectrometer.
There were no Test II, III, or IV studies conducted. Regarding Test II in particular, in the bounce studies and in virtually all independent studies of line broadening, no measurements outside the high field region were conducted.
The failure to study line broadening outside the high field region is herein labelled a killer design flaw. Why not conduct those simple “outside high field” experiments? Possibly, this failure was a product of something known as confirmation bias.
The scientists involved only conducted tests that would confirm their beliefs/models, probably without deliberate bias. That is, the design was only intended to show line broadening consistent with the FA model. Indeed, in some cases, as shown in Figure 8-3, the experimental apparatus consisted only of high field region, hence the study of line broadening in a low field region was not even possible!
In sum, the primary observation found in the experiments of the proponents of the FA models: Balmer line broadening in high field regions is consistent with expectations anticipated by both FA and RT models. That is, both models predict line broadening in high field regions. Hence, by design, the outcome of the “independent” experiments has no bearing on the relative validation status of either model.

Figure 8-3: Built in Limitations- Schematic of equipment employed (Ref 8-8) to study Ha line broadening. It is not possible to perform tests of broadening outside the high field region as the device consists entirely of high field region. Collection of data perpendicular to field also not conducted. Not shown: pumping system, pressure gauge, gas inlet, position of hydrogen lamp, dimensions. (From Ref. 8-8)
Other studies purporting to show the impact of cathode material on the magnitude of hydrogen line broadening also appear to have equipment limitations. For example, in one well known study (Figure 8-4), the Ha line broadening is mysteriously labelled in cm-1, rather than simply in nanometers.12 Given 10 cm-1 is intended to be a wavenumber it indicates the line width is of order 106 nm, clearly absurd. The “broadening” in shown in Figure 8-4 below is orders of magnitude too large to believe! It is very likely this colossal broadening is an artifact of a poor spectrometer.

Figure 8-4: Study of Impact of Cathode Material- All aspects of the presented data are puzzling, including the positioning of the spectrometer, labeling line widths in inverse centimeters (above), etc. (From Ref. 8-12)
Orientation Effect Studies
Regarding the impact of orientation relative to the accelerating field (Test I), which should be significant according to the FA Models, only one extensive study, with raw data, Cvetanovic et al., is available.13 It was focused on studying line broadening parallel and perpendicular to the field in a capacitively coupled RF system.
No evidence was found that persuasively showed a difference in line width as a function of the orientation of observation relative to the applied field. The only data reported by Cvetanovic, was provided in a figure (reproduced with modification below, Figure 8-5), not tabulated. Unfortunately, it was left to the reader to measure the broadening of lines obtained along the field axis.
A careful measurement by this reader (accounting for the enlargement of the scale of Panel C relative to that of Panel A and B) indicates line broadening perpendicular to the field is virtually the same as that obtained parallel to the field.
That is, super-hot hydrogen is clearly found in all directions, independent of the applied electric field.
This result is contrary to the prediction of the FA model family. To summarize: the only study of broadening as a function of orientation conducted by the independent investigators with raw data published and available for review debunks the FA model but is fully consistent with the expectations of the RT model.

Figure 8-5: Enlarging to Conceal- The reader of the study by Cvetanovic et al. is left to determine line widths perpendicular to the field (a, b) and parallel to the field (c). Once the panels are made to match in size (note panel c is enlarged by Cvetanovic et al., as shown by the added vertical blue line extensions of panels a and b) there is no evidence of a significant difference in line width as a function of orientation relative to the field. (After Ref. 8-13)
Recent and Alternative Models
Recently, alternatives to the FA family of models have been proposed to explain Balmer series line broadening; however, these studies are, like the FA studies, not designed to test the HH.1415 All possible outcomes are, because of the design of the experiments, consistent with the HH; however, as discussed below, the protocols did produce, serendipitously, data inconsistent with all FA models.
In contrast, in the next section of this chapter the focus is on experiments that were properly designed. That is, they were designed to debunk either the FA models or the RT model, with no ambiguity.
In the most complete experiments (Ref. 8-14) on line broadening with an alternative model, a unique apparatus for Balmer line broadening was employed. Plasma was generated in a high electric field region with pulses of less than 1 millisecond length, followed by pauses at least 10 times longer in duration. Once again, only one axis of spectroscopic observation relative to electric field was employed, and in this case the observation was perpendicular to the direction of the electric field. Not conducted were experiments designed to collect spectra away from the region between electrodes, nor was the temperature of the charged species determined.
It is possible to debunk the FA models using this apparatus because all FA models require a directional nature to any hot atoms; specifically, they should move orders of magnitude faster parallel to the applied field. Thus, no broadening should have been observed, yet, as shown in Figure 8-6 below, super-fast (10-25 eV) H atoms were observed.
Consistent with this finding, the authors of the study did not cite the FA model as an explanation for the observations. They cited a model that, to this author, seems extremely contrived (Ref. 8-14). Specifically, plasma electron induced dissociation of hydrogen molecules energy is released and this energy is converted to kinetic energy.

Figure 8-6: Normalized spectral line profiles at I = 200 mA- Pulse time of 400 μs at different gas pressures. Note the wings of the Ha line which were interpreted to indicate the presence of H atoms with kinetic energy between 10 (400 mTorr) and 25 eV (100 mTorr). Note the increased sensitivity as the FWHM of the central H line is <0.1 nm wide, vs ~0.5 nm in Ref (8.6). (From Ref. 8.14)
The model suffers from several serious defects:
Dissociation in all cases requires energy to be input. It does not occur spontaneously.
The net result of the dissociation process for the bound electrons is a change of their energy states. There is no conventional physics that allows for this process to generate momentum. According to Newton’s Laws, as there was no initial momentum, there must be no final momentum. No momentum increase, no line broadening. Not only does this model require energy release (!?) during dissociation, but there must be some means to explain how momentum was created/conserved! The RT model, in contrast, presents a clear mechanism around the issue of momentum. Specifically, in the RT model, in which a hydrogen molecule is the catalyst, momentum is conserved because each H atom, following dissociation, going off in a direction opposite to the other H atom in the original molecule. Moreover, each has the same energy. Thus, the momentum vectors are equal and opposite, leading to net zero momentum creation. There is zero net momentum at all times; thus it can be said “non-momentum” is conserved.
Finally, even the authors of this model cannot postulate a mechanism that could create H atoms with more than 9 eV of energy, hence the “dissociation model” is unable to explain the 25 eV data observed, or the even larger energies observed in other studies. Consistent with this analysis, there is no precedent cited for the notion of electron energy loss leading to kinetic energy increase of atoms or molecules. Only the RT model provides a theoretical basis for the conversion of tighter electron binding to kinetic energy, via Type II catalysis. Still, this study was valuable as it shows yet another independent observation of H atom Balmer series line broadening in plasmas.
In sum, the RT model of Balmer series line broadening predicts behavior which is consistent with all quality experimental studies conducted by independent observers. Even if it is accepted (herein that is done very reluctantly and with many caveats), that the data acquired by these labs is also consistent with the basic aspects of the FA models, nothing is resolved between the models.
Indeed, if two models predict the same set of observations, neither is debunked. Both models, if accurately predicting observed outcomes, are still valid. Hence, as there is nothing in the literature published by independent researchers on the topic of Balmer series line broadening that debunks the RT/HH model, it remains valid.
In fact, the agreement of RT predictions, no caveats, with myriad observations by a disparate group of researchers, greatly strengthens the case for the RT model and HH/GUTCP in general. Finally, it must be noted that all the data collected to support the FA models is inconsistent with the FA models in some respects.
In the next section we review the much tougher tests/better designed, higher quality, experiments of RT applied by the GUTCP-receptive community.
BLP-Related Lab Studies
In this section studies of Balmer line broadening conducted by BLP-related labs, that is non-independent labs, is reviewed. These were designed to challenge the RT theory and to determine if it better fits the data than the FA models.
To rephrase: These studies were designed to debunk the RT model. (The community of those who favor the FA models may find this an incredible claim, but the review of the work, below, supports it.)
This is the best practice of science was followed: deliberately challenge the theory, stay objective. The result: all data reported in these strictly reviewed and thorough studies designed to challenge the RT model are consistent with the RT hypothesis.
A secondary outcome: the data clearly debunk the FA models.
As detailed below, teams at BLP labs, the University of New Mexico/LANL (Team led by the author of this book), and a team at the University of Wisconsin, all designed tests to debunk the RT model. No data collected in these various laboratories debunked the RT model, hence all published reports of Balmer series line broadening in hydrogen containing plasmas is consistent with the predictions of the RT/HH/GUTCP theory.
The earliest laboratory studies of Balmer series line broadening in plasmas outside of BLP’s labs were conducted at University of New Mexico in collaboration with BLP scientists (8.1,8.2,8.3). As noted earlier, “proof” of a scientific theory is not possible. It is only possible to debunk a theory by demonstrating that predicted outcomes are not observed.
Some of the predictions of the RT model that the experiments were designed to debunk:
Test 1 RT Model: there should be zero orientation effect. Orientation relative to an electric field plays no role in the RT model, hence broadening will appear independent of electric field direction, and in fact is predicted to be totally isotropic (the same in all directions).
Test 2 RT Model: only pure hydrogen, or plasmas containing hydrogen and a catalytic species (e.g. Ar, He, H2O) should lead to Balmer series line broadening. Mixed plasmas that do not contain catalytic species, such as H2/Kr and H2/Ne, should not show significant broadened Balmer series lines.
Test 3 RT Model: line broadening of consistent magnitude should be observed throughout a plasma, in regions of no field, and regions of high field. The catalytic process is not electric field dependent. In the non-field regions, it is expected there will be fewer H atoms, hence the line intensity, but not line width, should drop away from the high field H atom source.
Test 4 RT Model: should be able to observe line broadening in all types of plasmas, DC, RF and microwave.
The above tests and anticipated results were discussed earlier and it was noted that if the FA models are correct essentially opposite outcomes are anticipated. In addition to the above tests, two more are added to the list of testable outcomes from the RT model:
Test 5 RT Model: the broadening will be energy quantized, reflecting the formation of Hydrinos of different energy. This outcome is not anticipated by the FA models.
Test 6 RT Model: the electron energy, typically the hottest species in RF and microwave plasmas, will be far cooler than the hot hydrogen atoms. There is no conventional model of plasmas in which atomic species are hotter than the electrons. Hence, this outcome is not anticipated in the FA models.
Any finding NOT in accordance with the above list of RT predicted behaviors would debunk the RT model.
In all the radio frequency (RF) plasma studies by UNM/LANL team, a standard RF GEC cell (Figure 8-7 below) was employed to study low pressure (on the order of 1 Torr) plasmas predicted to produce Balmer series line broadening.
Specifically, Balmer line broadening was studied in H2, H2/Ar, H2/He, and H2O plasmas. Also, in the same equipment, using similar parameters (e.g. voltage, pressure), several control plasmas (predicted by RT/HH theory to produce no line broadening) were also studied.
This system included a hollow power line to one electrode, ending in a quartz window, allowing the spectra to be collected in the high field region with a light fiber with a 9° acceptance angle placed inside the hollow power line, hence “looking” parallel to the direction of field between the electrodes.
Viewing the plasma with the same light fiber, moved to a position above the volume between electrodes, oriented “down,” allowed study of the spectra perpendicular to the high field region between the electrodes.
The “angle to the field” data can clearly distinguish the predictions of the two theories (Test 1). The FA model predicts minimal, if any, broadening for observation angles perpendicular to the field direction, whereas the RT model predicts there will be no effect of observation angle.
Also, as illustrated by the grid above the GEC cell in the (Fig. 8-7) it was a simple matter to collect spectra at any point in the GEC cell, not just between the electrodes, but at any distance up to 15 cm from the electrodes. Data from the light fiber placed at various “tilt” angles relative to the vertical were collected as well.
Notably, away from the volume between the electrodes the electric field drops off rapidly, which means that hydrogen ions in the rest of the cell cannot be super-heated by field acceleration. It also means there is not a surface from which an ion can bounce/reflect, as per the FA model explanation of symmetric line broadening.
In the low field regions, there will also be far fewer ions generated, and ions and electrons generated in high field regions are not expected to survive more than a few centimeters from point of production due to collisions with walls and other species.16171819
Moreover, any super-heated atoms would quickly thermally equilibrate, again within one or two centimeters, due to collisions. Thus, at a minimum, the FA model would suggest significantly reduced broadening due to thermalization of hot hydrogen, as well as an extremely sharp drop in the number of ions away from the volume between the electrodes.
In sum, a fully realistic expectation is that the FA mechanism would postulate zero broadening more than a centimeter or two away from the region between the electrodes. Yet, as discussed in more detail below, and as predicted by the RT model, there is line broadening, undiminished in magnitude, found everywhere in all those plasmas studied that contained both hydrogen and catalytic species (Test 3). There was no broadening found in plasmas not containing a catalytic species (Test 2). Moreover, between the electrodes the extent of broadening is independent of observation angle, parallel or perpendicular to the field (Test 1).
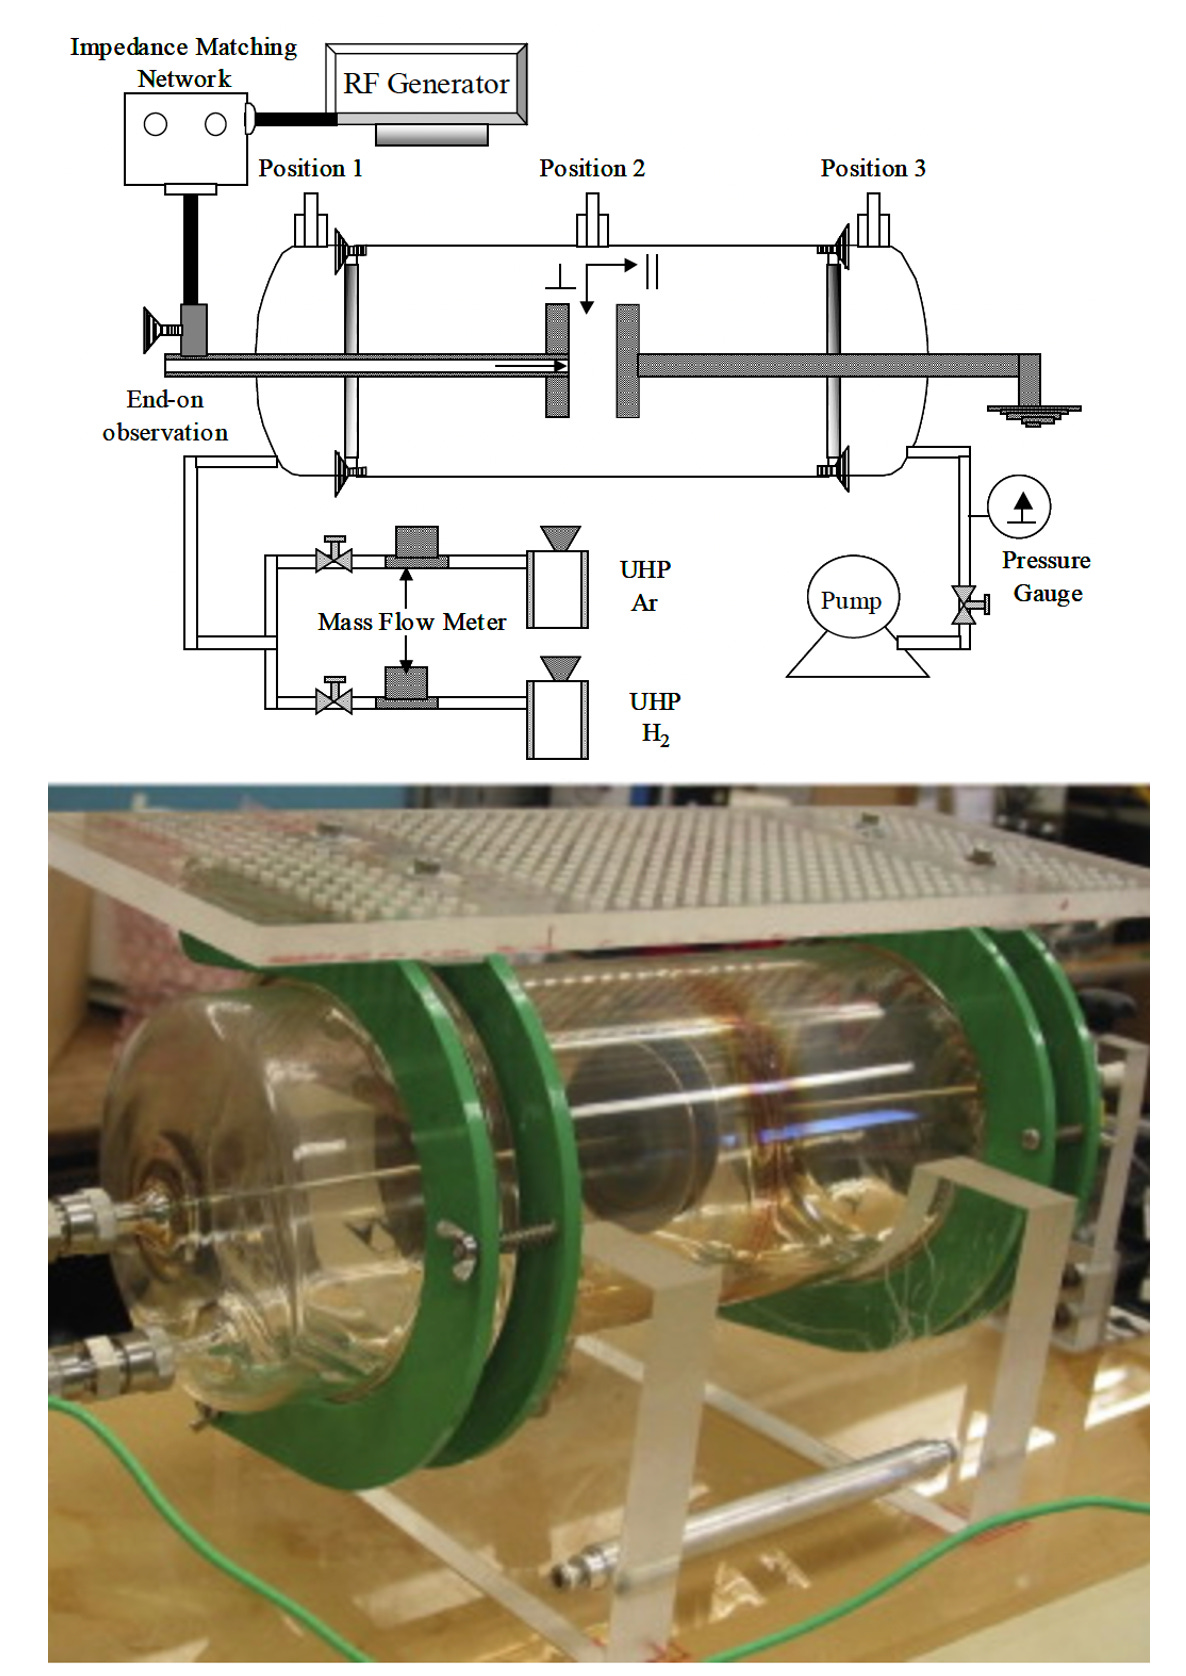
Figure 8-7: TOP Schematic of the quartz GEC system- Note that the cell is 14 cm in diameter and 36 cm in length. A quarter inch hole in the powered electrode allows end-on observation of Position 2, parallel to the electric field. BOTTOM: Picture of GEC cell, including grid used to position light fiber for collection of signal across entire plasma (After Ref. 8-1).
The first study (8.1) was one in which RF plasmas were struck from mixtures of H2/Ar. As shown below in Figure 8-8 (Test 3, and by inference Test 1), there is line broadening throughout the plasma. In this figure, data shows line broadening perpendicular to the applied field at three positions: between the plates, and near each end of the GEC cell 15 cm from the center point. The fact that there is line broadening, of the same parameters throughout, including at about 15 cm from the high field region between the plates is completely inconsistent with all FA models.

Figure 8-8: Balmer Broadening Observed Throughout GEC Cell- The magnitude of the line broadening in a 500 mTorr Ar/H2 plasma perpendicular to the applied field, and hence the energy of the hot hydrogen, was the same at the two end positions (Positions 1 and 3) and at the center (Position 2) of the GEC cell (Figure 8-7, top). The intensity difference simply indicates, as anticipated by the RT/HH model, higher H atom concentration in the high field region. (From Ref. 8-1)
As shown below in Figure 8-9, the extent of broadening, both parallel to and perpendicular to the field, was virtually identical in this region. In fact, the broadening is slightly higher when observed from a position perpendicular to the electric field. In addition, a host of observations showing that the extent of broadening for H2/Ar plasmas was identical throughout the plasma, over a wide range of observations angles.

Figure 8-9: Impact of Angle on Broadening in High Field Region- Position 2 (center) data shows in a mixture of argon and hydrogen, (300 mTorr, 100-200 W) the Balmer broadened component of the Ha line contains H atoms with about 24 eV of energy. The observation is nearly independent of the angle of observation. That is, the broadening observed perpendicular to the field direction is slightly larger than that observed parallel to the field direction. Under the same conditions, a pure hydrogen plasma shows significant, but lesser magnitude broadening, also independent of angle of observation. All results are consistent with the RT model. (After Ref. 8-1)
In Figure 8-10 below spectroscopic data collected between the electrodes is shown. Clearly, the lines consist of two components, narrow lines due to plasma temperature H atoms (ca. <1 eV) hydrogen and very broad lines indicating the presence of super-heated hydrogen atoms.

Figure 8-10: Ha Balmer lines from High Field Region of a Hydrogen/Argon (1/1) plasma, (300 mTorr, 100 W)- Peaks are composed of cold hydrogen line (center peak) and hot hydrogen component (wings). The same line shape is found throughout the plasma, both away from electrodes and between electrodes, and the magnitude of the broadening is independent of observation direction in all regions. (After Ref 8-1)
Another prediction of the RT model is that the temperature of charged species in the plasma is determined by standard plasma physics. In fact, all measured plasma parameters were consistent with this expectation. And, according to Test 6, the temperature of electrons (and all species) will be less than that of the super-hot hydrogen.
The excitation temperature (i.e., atomic hydrogen temperature), computed from the relative intensity of the Balmer series lines per standard plasma physics, was found to be below 0.7 eV at all times and at all positions. It was a weak function of position, always somewhat higher (ca. 0.8 eV) away from the electrodes. Average electron temperature was measured as a function of position and was found to be slightly higher between the electrodes, but less than 0.8 eV everywhere in the cell.
Notably, the magnitude of the two temperatures, although not the temperature profiles, are very similar. This suggests that all the species within the plasma are thermalized, meaning all species, atoms, molecules, and ions, have nearly the same temperature, except the super hot H atoms (Test 6).
The 2nd Law of Thermodynamics is relevant here: heat energy always moves from the hotter body to the colder body, never the other way around. Thus, by the 2nd Law, superhot H atoms (>25 eV) do not draw energy from other species in the plasma, because, as noted, all other species are more than 25 times cooler ((<1 eV vs. >25 eV) in absolute terms. There must be a mechanism other than “heating” that is provided to explain super-hot H atoms existing throughout the GEC cell.
Another feature of the data is the relative intensity (relative areas, after standard fitting protocols), Ha Cold/Ha Hot observed (Figures 8-7 and 8-9). That is, deconvolution of the clearly convoluted peak into two individual peaks (8-1) indicates that between 15% and 40%, function of power level of the emitting H atoms are “super-hot.”
This raises the question, why? It certainly is not consistent with the FA model as that requires H ions to pick up energy from the field, but, as noted earlier, it is generally understood that 99.9% or more of all species in a terrestrial low power RF plasma are neutral. Hence the FA model predicts most emission will be from neutral, but excited, hydrogen. The expectation from the FA model is that the Ha line will have two components: a large narrow Ha line from hydrogen at perhaps 1000 K, and a very small broadened Ha peak from field accelerated hydrogen, observed at the foot of the peak. This expectation of the FA model is the opposite of that observed.
In contrast, the RT model has no upper limit on the relative fraction of superhot atoms produced via Hydrino formation. Indeed, in the RT model the hot hydrogen atoms are initially standard (non-ionic) hydrogen molecules which are known to make up >99% of all hydrogen in an RF plasma. The finding that a large fraction of the H atoms are super-hot is consistent with the RT model. Thus, only the RT model is consistent with observations.
The final aspect of the data here is the impact of catalytic species. Is argon a necessary component of the mixture (Test 2)? Clearly, pure hydrogen does produce some, very limited in fraction of total hydrogen lines (ca. <5%), but still measurable, broadening. Indeed, compare Ha broadening of H2 and H2/Ar plasmas in Fig. 8-10. The reduced impact of hydrogen as a self-catalyst in a flow system is consistent with RT theory.
A real test was also run: no argon and reduced hydrogen concentration. As shown in Figure 8-11, in the absence of a catalytic species, even in the highest field region, the line broadening under identical conditions is insignificant relative to that observed in H2/Ar plasmas. This is one more example of an outcome predicted by the RT theory for which there is no explanation in the FA models.

Figure 8-11: No Catalyst Plasma- In a H2/Xe mixture, 100 W and 300 mTorr, almost no line broadening is observed, even in the highest field region between the electrodes. This is consistent with the RT theory that a catalytic species must be present in high enough concentration to observe any line broadening. Note the sensitivity of the spectrometer produced FWHM line widths of <0.03 nm, compared with minimum line widths of ~0.5 nm in some FA work, as shown in Figure 8-2. (After Ref 8-1)
A second set of experiments conducted independently by the University of New Mexico team focused on characterization of a plasma generated in a GEC cell from pure water at low pressures (Ref. 8-2). This work confirmed the main points of the work with H2/Ar plasmas:
Test 1 and Test 3: Line broadening is independent of position in the plasma and direction of observation.
Test 2: No line broadening in plasmas without catalytic species.
Test 5: Evidence that the line broadening is quantized as a function of catalyst species.
Test 6: Electron temperature less than one eV, thus more than an order of magnitude cooler than the hot hydrogen atoms.
In addition, in the pure water plasma study the line broadening of three of the Balmer series lines were measured, and all showed the broadening anticipated by the RT/HH theory.
In Figure 8-12, the result of deconvoluting the Hb line to three components is shown. Hb was selected to demonstrate that all the Balmer series lines are broadened as predicted by the RT theory. Warm (<2 eV) and cold (<0.2 eV) are not related to Hydrino formation. Both are anticipated in a plasma in which the electrons are of the order 1 eV in energy.
The ~70 eV hydrogen, found for all Balmer series lines, over a “sweet spot” of pressure was not found in H2/Ar plasmas. However, the RT/HH theory suggests there should be decomposition products of water in the plasma enabling larger energy transitions to lower/smaller Hydrino states, and hence higher H atom energies. Recall: there are 136 Hydrino states. The smaller the Hydrino, the larger the energy release during its formation.
The smaller Hydrino states are not predicted to form in high concentration in H2/Ar plasmas, and experimental results are in agreement with that prediction (Figures 8-8 and 8-10).

Figure 8-12: Hb Line Broadening in a Pure H2O Plasma- Shown are the energy of H-atoms as a function of pressure in the GEC cell obtained from the broadening of the Hb Balmer series lines in a pure RF water plasma. The data from the Hb lines illustrate the fact that all the Balmer lines are broadened, whereas careful study of oxygen lines in this plasma showed no evidence of line broadening. The existence of H-atoms with temperatures about 2 orders of magnitude hotter than the electrons simply cannot be explained by conventional plasma physics. (After Ref. 8-2).
A third study employing the illustrated GEC cell was conducted with a low pressure H2/He mixture (Test 5). As anticipated by the RT/HH theory, this type of plasma did not show the extreme broadening observed in the water plasma (Ref. 8-3). Indeed, the nature of helium as a catalyst is distinct from the anticipated catalytic behavior of oxygen species found in water plasmas. The best explanation presently available is presented in the Author’s Concerns section, below.
The experiments were also designed to test for the impact on field strength in the region between the electrodes (Test 3). It is a good experiment for distinguishing between model predictions; indeed there are “opposite” outcomes predicted by the RT and FA models. The RT model suggests field strength/power level should have virtually no impact on the magnitude of the broadening, whereas according to the FA models, the magnitude of broadening should be directly proportional to the field strength/power level. Hence a test of the impact of RF power level should favor one theory or the other.
In sum, the data strongly favors the RT model.
It was shown that input power over a range from 40 W to 150 W, which increased measured rms voltage by a factor of ~2X, had little impact on the magnitude of the broadening (Fig. 8-13b).
The data also shows (8-13a), as expected, the overall intensity of the Ha line declines with distance from the high field region between the electrodes. Increasing distance from the high field region correlates with a lower electron density and hence a slower rate/lower density of catalyst production of catalyst production (He+), hence lower concentration of excited hydrogen, a species necessary for Balmer line production.

Figure 8-13 A&B: Impact of Distance from Electrodes in H2/He Plasma- A) Away from the high field region the concentration of H atoms is reduced as anticipated by FA and RT models. B) The magnitude of Ha line broadening is independent of position within the plasma, and amount of power supplied to the plasma. Both of these results are inconsistent with the predictions of FA models, but consistent with the RT model. (After Ref. 8-3)
And, in this study, as in the other two GEC cell studies, the hot hydrogen temperature was found to be independent of position in the cell and orientation (Test 1 and Test 3). The best approach to understanding this independence of line broadening on position applied power, voltage, etc. is to think of Hydrino formation as a chemical reaction.
To wit: a chemical reaction, leading from specific reactants to specific products (e.g. hydrogen and oxygen reacting to form water) is always associated with a precise change in the free energy of the system. This is essentially because electrons move from a pre-reaction quantized energy state to a post-reaction, lower energy, quantized state. As these states are quantized, it is never anticipated that reactions will lead to a range or spectrum of energy release. Very specific energy release is always anticipated because of quantization of energy levels.
To repeat: in an exothermic reaction, the electrons are moved from specific “high energy” configurations to specific “lower energy” states, releasing specific amounts of energy for each reaction.
In a chemical reaction there may be different power (energy/time) generated, but the energy, reflected as per example in the voltage of a battery, will be nearly independent of virtually every operating parameter. For example, battery voltage is constant, until near complete discharge of the battery, as it reflects the free energy change (DG) of a particular chemical reaction.
Also, each battery type is based on a different chemical reaction (e.g. lithium-ion chemistry is totally different from lead-acid battery chemistry), and this is reflected in a different constant voltage output associated with each type of battery. For example, lithium-ion batteries deliver on the order of 3.6 V, and lead acid on the order of 2.1 V.
Similarly, each type of plasma favors a different hydrogen atom to final Hydrino state reaction, hence each has a characteristic Delta G (energy released during reaction) of reaction and concomitantly a specific super-hot hydrogen energy, independent of position, relative amount of super-hot hydrogen, etc.
Getting into the weeds: a final comment concerns the existence of any H atoms outside the region between the electrodes. To wit: If super-hot hydrogen atoms are postulated to rapidly thermally equilibrate due to collisions away from the high field region, shouldn’t H atom concentrations drop rapidly away from the high field region? Indeed, molecular hydrogen dissociation should be dramatically higher, due to collisions with hot electrons, in the high field region.
A drop in Hydrino formation, linked to H atom concentration (since Hydrino formation requires atomic hydrogen), is observed away from the high field region (Figures, 8-6, 8-12a), but it is not a rapid drop. If no new hydrogen atoms are generated away from the field region, and recombination due to collision is rapid, why does the super-hot H atom concentration, all studies (Refs. 8-1, 8-2, 8-3), drop so slowly with distance from the electrodes? Can this be explained?
The basic answer: hydrogen atoms can only recombine if they encounter another hydrogen atom in the plasmas under consideration. In contrast, none, or perhaps only a few (see Author’s Concerns section) of these collisions will create a stable product; H-Ar, H-He, H-H2, H-H2O; however, an H-H collision will create a stable molecule. In contrast, any collision, any two particles, will lead toward thermal equilibration, hence thermal equilibration will occur much faster than atomic H loss.
For example, if the H atom concentration reaches a max of ca. 5% of all species in an H2/Ar plasma, not more than 2.5% of all collisions can lead to recombination/molecular hydrogen formation. Hence, if full thermal equilibration occurs because enough collisions occur within 1 cm of the electrodes, the same net number of H-H collisions will not occur until of the order of 40 cm from the generation source. Moreover, as recombination occurs, the H atom concentration decreases, such that the percent of H decreases and concomitantly the rate of H atom recombination.
This suggests H atoms recombination will slow away from the electrodes and hence H atoms should be everywhere in a GEC cell in which the farthest point from H production is no more than 15 cm (Figure 8-13a).
There is clear experimental support for the general hypothesis that, once formed, H atoms are stable until they encounter another H atom. A good example are studies showing that H atoms created on noble metal (e.g. Pt/carbon) heterogeneous catalysts remain chemically active even after transport at one atmosphere pressure through several centimeters of gas phase convection/diffusion (Figure 8-14).20

Figure 8-14: Hydrogen Spillover is Real- In this study samples were treated in flowing pure hydrogen gas at the temperature shown on the ordinate. The degree of surface reduction/surface oxygen removal corresponds to the measured surface Point of Zero Charge (PZC). The easiest reduction is for the commercial Pt/C, suggesting H atoms on the Pt have very easy access to oxygen groups via H surface diffusion, as per standard understanding of H spillover. The novel result is the finding that Norit Pt “air gapped” from Pt is still impacted by H-spillover. Indeed, as PZC is a base 10 exponential number (like pH), the data shows (arrows) that Nc downstream from an H atom source has ~100 x more surface oxygen removed than the same carbon in the absence of an H atom source/Pt anywhere in the reactor. It is reasonable to postulate H travels through the gas phase, even at 1 atm pressure. (From Ref. 8-20)
Another supporting study: the slow falloff in O atom concentration in the afterglow of flowing gas microwave plasmas also indicates that atomic radicals must collide with select other species (e.g. other O atoms) to recombine (Figure 8-15). Indeed, in the case of the microwave generated oxygen plasmas, it was shown that in the afterglow all charged species combined long before the O atoms recombine to form the energetically preferred O2 molecule. This result is a further demonstration that it is reasonable to postulate radicals in a GEC cell produced in the high field region between electrodes can survive to populate the entire reactor.21

Figure 8-15 A&B: Pt Etching in Microwave Generated Oxygen Plasma- A) The apparatus employed to measure all species temperatures in the afterglow of a microwave oxygen plasma. B) Concentration of species, and correlation with etch rate in the afterglow. Note, O atoms survive longer than charged species. (From Ref. 8-21)
Other Line Broadening Studies
Another variation of the RF line broadening studies, conducted by a different team of senior, well-regarded scientists at the University of Wisconsin, was the use of thin wire electrodes, rather than plate electrodes, as shown below in Fig 8-16.
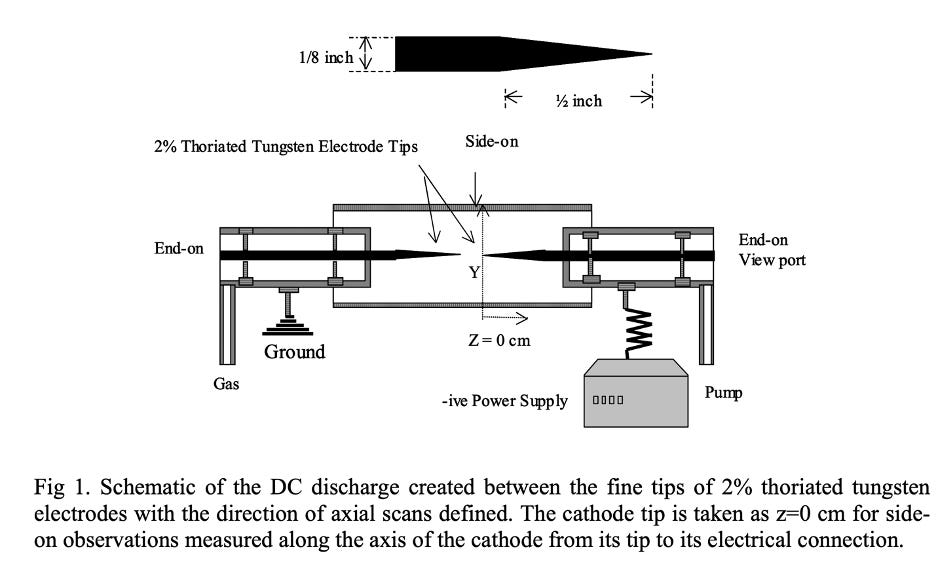
Figure 8-16: Testing Impact of Electrode Shape- Advocates of the FA model require H ion “bounce” off electrodes to explain some aspects of data. This apparatus nearly eliminates any symmetric broadening mechanism that requires species to “bounce” off electrodes, as the electrodes are needle shapes. (after Ref 8-22)
The plasma device shown was designed to permit Balmer line broadening to be studied both parallel and perpendicular to the direction of field applied between the tips, and as a function of position within the discharge.22 As exhaustive studies showed, as predicted by GUTCP theory, the Balmer series broadening consistent with atomic hydrogen energy of order 30 eV was detected everywhere, and at all angles (Test 1, Test 3).
No other ionic or atomic species lines were at all broadened, also consistent with the theory. Moreover, three plasmas were studied: H2/Ar, H2/He, and H2/Xe (Test 2). In the H2/Ar and H2/He plasmas >30 eV hydrogen atom temperatures were measured everywhere and without any evidence of preferred direction on the basis of the magnitude of the line broadening. In the H2/Xe plasma no hot hydrogen was found. In fact, the highest temperature hydrogen in H2/Xe was less than 1 eV. These plasma gas dependent results are exactly as predicted by the RT/HH theory. That is, only those plasmas containing a proper catalytic species will create a significant population of super-hot hydrogen, thus providing evidence of Hydrino formation.
Other observations from the needle electrode plasmas were also consistent with the RT/HH predictions. For example, Langmuir probe studies showed the electron temperature in all gas mixtures was less than 1 eV, everywhere in the system (Test 6). No standard theory is consistent with atoms being hotter than electrons in any plasma.
Indeed, the standard understanding of plasma physics is that electrons are the species that absorb field energy. After direct heating by the field, these “hottest-species-in-the-plasma-electrons” transfer it, consistent with the 2nd Law of Thermodynamics, to other species, such as ions, and atomic species via ionization. And the 2nd Law of Thermodynamics clearly indicates thermal energy transfers only from hotter objects to cooler objects. Clearly, electrons at 1 eV transferring energy to 25 eV+ hydrogen atoms is a violation of the 2nd Law of Thermodynamics. In sum, standard plasma models indicate the hydrogen atom temperature, particularly outside the high field region, cannot exceed ~1.0 eV, as per H2/Xe plasmas.
Microwave Plasmas
In addition to all the RF and DC plasma examples discussed above, there are also thorough, reviewed, published articles in which Balmer series line broadening >20 eV is observed in microwave systems (Test 4).
According to the standard theory of plasmas, this is not possible as the only species capable of absorbing energy from the microwave field are electrons. Ions may be somewhat accelerated by fields in RF systems, but their relative bulk does not permit them to absorb energy at microwave frequencies (ca. 2.42 GHz).
For this reason, in a microwave plasma there is no possible conventional explanation for finding ions hotter than the electrons.
As the FA models require hot H+ ions to be accelerated, there is no mechanism consistent with FA models possible in a microwave generated plasma.
In a study of Balmer line broadening in microwave pure water plasmas over a range of pressures the Balmer line broadening was measured to be approximately 2.5 Å, indicating energy of some H atoms of ~ 50 eV (ca. >550,000 K).23 This extensive line broadening was observed as much as 5 cm distance from the edge of the Evanson microwave coupler.

Figure 8-17: Line Broadening Found in a Microwave Generated Plasma- Line broadening of the Balmer Ha line was only found in microwave pure water plasmas operated at or below 1 Torr (a and b). Oxygen atom lines were not broadened in the same plasmas (d) RF plasmas produced no line broadening (e). All results are consistent with predictions of the RT model. (After 8-23).
Concomitantly to collecting the Balmer line, the spectroscopic lines from transitions in excited oxygen species were also collected. These lines, barely broadened (Fig. 8-18), indicated the oxygen species were of the same temperature as the rotational temperature of excited species (OH*), that is, less than 3000 K. Moreover, the rotation temperature obtained with an RF coupler and a microwave coupler on the same plasma yielded nearly identical temperatures.

Figure 8-18: Only H lines Broadened- It has been consistently shown that only the H lines in a plasma containing RT catalysts are broadened. This is an outcome predicted by the RT model but an impossible quandary for the FA models. (After 8-20).
Another example of broadening in a microwave shows explicitly that the degree of broadening of the hydrogen lines is a function of the identity of the gas mix. In pure hydrogen there is slight broadening, more Balmer broadening is observed in H2/Ar, and even more in H2/He (Figure 8-19). No broadening was detected in a H2/Xe plasma.24

Figure 8-19: Balmer Broadening in a Microwave Plasma- As shown (left) there is considerable broadening in a DC generated H2/Ar plasma, but even greater broadening (right) in a microwave generated He/H2 plasma. (After Ref. 8-24)
In this study, the BLP team also explicitly shows that it is only the hydrogen lines and no other lines that are broadened. As shown in Figure 8-20, in the same plasmas in which Balmer line broadening is observed, there is no broadening of argon or helium lines.

Figure 8-20: Only Balmer Lines Broadened- In the same plasmas in which there is dramatic broadening of the Balmer lines there is no broadening of any spectral lines arising from other species in the plasma. Lines for He and Ar are the same in both RT and non-RT plasmas. (After Ref. 8-24)
Finally, it is important to emphasize a clear contrast between the studies conducted by teams “testing” the FA studies with those working to debunk the RT model: only the latter group performed studies designed to debunk.
Regarding the former: almost no data regarding orientation impact was collected, and the little presented contradicts the FA model. Only one gas mixture, Ar/H2, was employed. Also, in the FA studies there is zero experimental data regarding line broadening in those portions of the cell outside the region between electrodes. The impact of these parameters and others were subject to intense experimental exploration in RT studies.
Is it perhaps the case that the experimental designs for Balmer series line broadening of groups not associated with those attempting to debunk the RT/HH model reflect FA model confirmation bias?
That is, the experimentalists seem to have assumed the FA model to be correct, and did not design experiments to debunk it, but rather to support it. Is this proper science? For example, as noted, broadening outside the high field region was never studied. This reflects the assumptions of the FA model: line broadening can only occur in high field regions. Also, only single gas, hydrogen, and one gas mixture, H2/Ar, were ever studied. Again, the design of the experiments appears to reflect the assumptions of the model. In this case, the identity of the non-hydrogen component in the FA models is irrelevant.
Another feature of the studies reflecting model bias was the failure to determine the H atom temperature as a function of the orientation of the collection device relative to the electric field direction. In fact, there is more data reported in any one of the RT testing studies reviewed above than the sum of the data in all the FA model papers.
Summary of Line Broadening Studies
All the hydrogen line broadening studies are consistent with the RT/HH theory, whereas in contrast the data is generally completely inconsistent with the “mainstream” FA models.
Specific examples:
Balmer line broadening was found everywhere in RT plasmas, independent of electric field strength. This finding, including line broadening 15 cm from a significant electric field, is predicted by RT/HH theory and inconsistent with FA models. According to FA models the broadening should only be found in high field regions, such as between RF electrodes.
No preferred direction for Doppler broadening of high-speed hydrogen was observed, a finding predicted by RT/HH theory, and totally inconsistent with FA models. In FA models Doppler line broadening should only be observed along the electric field axis.
In the above reviewed studies, broadening was only observed in plasmas containing catalyst species, consistent with RT theory, and inconsistent with FA models. In FA models, Balmer series Doppler line broadening is not a function of the presence/absence of other gases, thus line broadening should be observed in all plasmas containing hydrogen.
The broadening was “energy quantized,” reflecting the formation of Hydrinos of different energy. This finding is predicted by GUTCP theory. In contrast, the line broadening in the FA models should be a continuous function of the applied field. No evidence of applied voltage/field strength modification of line broadening has ever been observed.
The electron energy, always the hottest species in non-RT RF and microwave plasmas, was always far cooler (more than order of magnitude cooler) than the hot hydrogen atoms, both in the high field region and in the no-field region. This finding is predicted by RT/HH theory. Indeed, in general the Balmer series line broadening indicated H atom temperatures more than an order of magnitude hotter than that of the electrons. This finding is inconsistent with the FA or other standard plasma models for which there is no basis for any ionic species existing that is hotter than the electrons. In particular, there is no plausible non-RT mechanism for H atom temperatures of the order 550,000 K in a plasma for which the hottest electrons are less than 25,000 K.
Line broadening, of nearly exactly the same nature as that found in DC discharge and RF plasmas, was observed in microwave plasmas as well. This finding is predicted by RT/HH theory. In contrast, there is no explanation for this in the FA models. No explanations for this in standard plasma models. None.
Not a single finding in all the studies of Balmer series line broadening in RF or microwave plasmas is inconsistent with the predictions of RT/HH theory, hence that theory is not debunked. In contrast, it appears that the FA models as a class are thoroughly debunked.
Balmer Line Broadening in Stars
Another GUTCP prediction regarding Balmer lines is that these lines should be broadened in the spectra of stars. Stars largely consist of hydrogen and helium, a mix predicted by GUTCP theory to lead to the formation of Hydrinos, and concomitantly the “tell” of line broadening in the spectra of hydrogen.
And indeed, Balmer series line broadening is observed in many stellar spectra, including flares and some particular star classes (e.g. cool Ap stars, A and F dwarfs).252627282930
In flares, as in most laboratory systems, it is clear that there are two types of hydrogen. That is, the spectral lines are composed of two components, a central line, which is only modestly broadened, and extremely broadened wings.
Most astrophysics interpretations assume that the modest broadening of the central line comes from Doppler broadening, and the wings come from Stark broadening, that is broadening due to very high density of charged particles.
There are some exceptions: for example, one model (Ref. 8-30) suggests the broadening results from a phenomenon called “electric pressure broadening,” as they assert the standard Stark models fail. The fact that there are two theories, conventional and the GUTCP, to explain the data does not impact this statement: there is no data from astrophysical data that debunks the GUTCP theory.
As predicted by the GUTCP, lines of the hydrogen spectra are broadened in astrophysical objects.
Occam’s Razor.
Author’s Concerns
Three problems with the current GUTCP theory of the mechanism of line broadening, and the mismatch of that theory with experimental data, were identified in the Author’s Concerns section of Chapter 7.
The first was the lack of a simple mechanism to explain energy transfer to create kinetically superhot H atoms. The FA model is not supported by data.
The second is the enhancement of the fraction of H atoms showing broadening in plasmas containing catalysts relative to that in pure hydrogen. There is broadening in pure hydrogen plasmas, as predicted by GUTCP, but why far less than in argon, helium and water containing plasmas. There is no explanation offered.
The third is the clear experimental connection between the magnitude (eV) of line broadening, and the identity of the catalytic species in the plasma. There is no clear prediction in GUTCP theory regarding this phenomenon.
All these issues are made even more clear after a review of line broadening data presented in this chapter. A more detailed mechanism appears to be required.
Others have also noticed the mechanism problem. In a Master’s thesis, never converted to a peer reviewed publication (8-31) some mechanisms for producing fast H atoms were postulated.31 As discussed in Ch. 7, according to the Source Text the energy released during the second step of Hydrino formation is employed to make EUV photons. In contrast, de Maat suggests a second channel for that second step energy release: generating fast hydrogen. To wit:

Where H*(1/ni) is a transition state. The energy released when a transition state (H*(1/ni)) is converted to a Hydrino (H(1/ni)) is presumably converted into kinetic energy in this mechanism, hence creating the observed Hfast.
Applying both momentum and energy balances to this reaction model indicates that a Hfast from an Argon plasma (which promotes formation of H(1/2)) will have a kinetic energy of ~7 eV, far from the multiple laboratory measured value of about 26 eV. Other proposed mechanisms by de Maat were simply not suited for quantitative energy predictions. Problem not solved.
It is also notable, as a last example, that the data collected on line broadening by de Maat serves as an effective visual summary of all the data on Broadening in plasmas. As shown in Figure (8-21) the greatest broadening, in very near identical conditions (some variation in DC discharge voltage only), shows the magnitude of the broadening is in this order: H2/He (41 eV) > H2/Ar (25eV) > H2 (3.5eV) > H2/Ne (0.24 eV).
There is one issue which must be addressed: the listed broadening for H2/Ne discharge plasma includes a component that is broadened to ~73 eV. Perhaps this value is an artifact of the fitting routine? Possible, but below, it is argued that there may actually be some Hydrino formation in the H2/Ne plasma, and the peak is not an artifact, despite Ne not being one of the standard atomic catalysts of Type I as described in Ch 7.

Figure 8-21: Balmer a Broadening Observed in a DC Discharge for Four Different Gas Mixtures- All plasmas were run at the same pressure and gas flow rate, only the voltage was varied, probably to attain a stable plasma in each case. A) He/H2 (5%) clearly shows 41.2 eV broadening, B) Pure hydrogen. Very little broadening. C) Ar/H2 (3%) 24.8 eV broadening. D) Ne/H2, no significant broadening in the main, but possibly a small fraction of H at 73eV. (From 8-31)
Here a new mechanism is proposed, one consistent with known noble gas compounds. Specifically, some thoroughly demonstrated noble gas hydride ions form in the plasma, with a twist. For example, a standard proposed mechanism, one that occurs in a DC discharge for the formation of argonium (ArH+):32

The proposed twist is the following:

Where H* is the Hydrino (1/2) transition state, rather than a standard state hydrogen atom. That is, the reaction produces both a Hydrino (1/2) transition state, in which the 27.2 eV released in the process is partially (more below) transferred to a fast hydrogen atom. It is anticipated, second step, that the reaction will progress to form a Hydrino or an ArH(1/2) molecule. This second step does not contribute to Hfast generation or energy.
Similar noble gas (ionic) hydrides are known to exist, and also known to be chemical radicals (species that cannot be stored and shipped) that quickly decompose into more stable parts, and hence must be observed as they are generated. In fact, in 1925 the first noble gas hydrides were detected, HeH+ and HeH2+, in a discharge created by ionic bombardment of gas mixtures of helium and hydrogen.33 It is now considered to have been the first molecule to have formed after the Big Bang.34 Significant: the spectroscopic signal of this molecule has been clearly observed in Inter stellar space, for example in “young” nebula. Remarkably, argonium has also been detected in nebula!35
In any event, it is cautiously and uncertainly postulated this reaction is responsible for the formation of fast H in a helium plasma:

Where H* is the Hydrino (1/3) transition state.
As the reader will discover in the next chapter, this is consistent with observations of spectral lines produced found in interstellar media, which are consistent with spectral lines predicted by the second step of Hydrino formation.
Returning to the observation of a small amount of 73 eV hydrogen in the Ne/H2 plasma of deMaat: is it possible this is an accurate observation of some fast H produced via the formation of a neon hydride? A brief Google search will lead the reader many demonstrations of the existence of NeH+. In parallel with the Ar and He reactions above, this reaction is cautiously postulated:

Where H* is the Hydrino (1/4) transition state.
The final energy of the fast H atom will be a function of the energy released, conservation of momentum and conservation of energy.
The momentum balance:

where M is the HeH*+, or ArH*+, etc. is combined with the energy balance to provide a general equation for the relative fraction kinetic energy (Ekin) of energy in each species:

Thus, the energy ratio of the two colliding species is inverse to their mass ratios. In short, the lighter participant, always H, will gain most of the energy.
The anticipated EkinH based on this solution are given in Table 8-2:
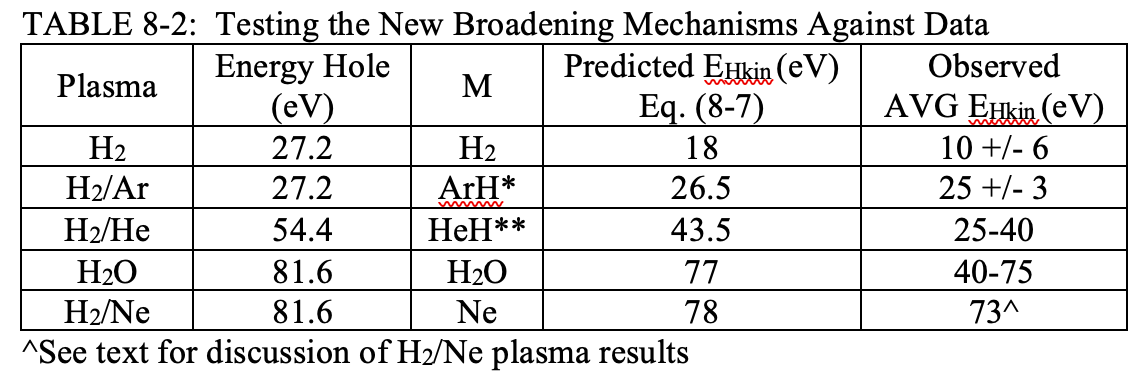
There are many positive correlations between Predicted and Observed in Table 8-2. Note that the line broadening in Ar is observed to be greater than that found in a pure H2 plasma, as predicted despite both in theory yielding the Hydrino transition state.
Also, energy for EHkin is experimentally found in this order: H2<Ar<He<H2O, as predicted.
However, there are clearly issues. For example, should the Ne results be included? Still a question. Also, the predicted EHkin in Table 8-2 are a bit lower than the values in the Observed column. This possibly is a result of comparing average values, with maximum values. That is, without providing detail, the Observed values are the average of many values, whereas the predicted values are the maximum energy to be created according to theory. (Explaining this in detail is too complex for treatment in the present narrative.) Another possibility is that as part of the process the “missing” kinetic energy “pumps” the H atom into an excited state. Still, it is clear the proposed mechanisms, if correct, speak to the three objections noted in the first paragraph of this section. To wit: the mechanisms are simple requiring only two body collisions, suggest that the fraction of fast H can be a function of the kinetics linked to the catalyst atom present, and suggest that the energy should be linked to the catalyst identity.
The take-away message: there is reasonable quantitative agreement between predicted and observed values of energy of hot hydrogen. The new mechanism remains valid.
It is important to note that the new theory is also generally consistent with GUTCP according to the Source Text where it is noted that a kinetic energy channel may exist during Hydrino formation such that fast H, rather than a photon, can be created during Hydrino formation. It should be noted; however, that the mechanisms postulated, Eqs. 8-3, 8-4, and 8-5 are not directly suggested. To wit:
Personal Note
Wisdom
In my first-grade class, a peer and family friend by the name of Michael was the ordained class genius. Michael did all he could using bravado to reinforce that perception. My mother was not so impressed.
One day my mother was in charge of several little boys and took us all shopping at the local Co-Op grocery store as a means to keep us busy. Or maybe she just wanted to buy dinner. Michael was employing his normal bravado and charm, at the moment boasting of his mathematical acumen.
My mom, clearly skeptical, became involved. ‘Can any of you tell me how much is 3 times 12?’ Michael without hesitation answered “30!” and naturally the rest of us mimicked the self-appointed maven of mathematics. “30!” I yelled in total confidence. My mother looked at me and said: “think for yourself.”
A minute or so later I got it right: “36!”
A Comment on Critics (aka Those Without Wisdom)
There are a few critics of GUTCP that stand out. One in particular, A. Rathke is frequently cited by critics of GUTCP, yet the Rathke analysis is completely misguided, or perhaps generated as a form of deliberate misinformation. The fundamental error is immediately obvious, as per this out take from Rathke:36

Examine the earlier chapters and ask this question: Where is the “assumption” that electrons are described by a classical wave equation in the GUTCP? Answer: nowhere.
And the misinformation machine continues, including this assertion:
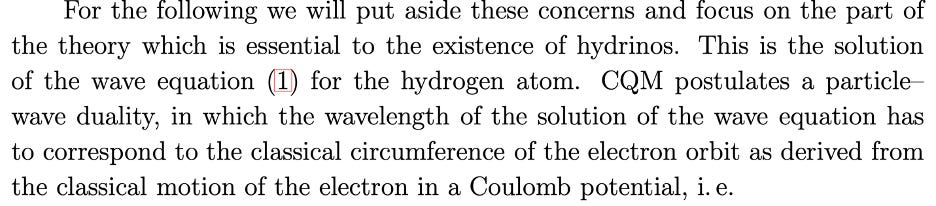
More complete balderdash. Where in the preceding chapters is there any mention of a “particle wave duality?” Is this guy drinking Kool-Aid?
The orbitsphere is a postulated model, which is then tested against known data using only classical, pre-1872, physics. The orbitsphere structure, consisting of a very large number of great circle current loops of identical radius, but at many angles is NOT a solution to a wave equation of any kind.
Dynamics? As described in the GUTCP, the electron orbitsphere, including that of the Hydrino, bound to a nucleus, is a static object. Is a soap bubble shape the solution to a wave equation? Does it have “particle wave duality?” Is the earth a sphere because it is a solution to a wave equation? Not everything is the solution to a wave equation, and not everything has particle wave duality.
One example of employing the Rathke critique to bolster the basic “the GUTCP is fraud” narrative can be found in Wikipedia:

Again, complete (malicious?) gibberish.
As noted in the first part of this monograph, the GUTCP is not a version of standard quantum mechanics, it is an entirely new paradigm. Of course it is inconsistent with probability density function(s) generated by one of the many approximations to the true Schrodinger equation (Chapter 4).
It is inconsistent with all solutions to all approximate versions of Schrodinger’s equation. There is NO Schrodinger equation in the GUTCP. It doesn’t exist.
Rejecting the GUTCP because it does not agree with standard quantum is much like flat earth folk saying the earth cannot be a sphere because a sphere is not compatible with their model of a flat earth…
Rathke’s entire analysis is complete gibberish. Those who cite it, like the editors of Wikipedia, perhaps do so for one of these reasons:
It is convenient support for a narrative, that narrative being the GUTCP is wrong, wrong, wrong.
Inability to independently evaluate GUTCP, hence echo the “experts.”
Their paychecks, both monetary and psychic, depend on their inability to understand the GUTCP.
Does the GUTCP have the “right” to postulate the form of a bound electron? To paraphrase arguments made earlier in this monograph: everything in physics, from the 1/r2 fall off of gravitational and electric fields, to Special Relativity and the Schrodinger equation, are postulates.
No divine being supplies the physicists with the keys to the universe. Humans make postulates, and then they are tested against observation.
This brings up another fallacy: it is too often implied that only those with correct credentials are eligible to question authority.
No.
Science is not about credentials. It is not personal. To be validated, all theories must be tested against observations, not against “expert” opinion. Checking the credentials of the author of the theory is not part of the evaluation process.
Combating Critics
How to combat the critics? A strategy embraced by BLP from the beginning was to generate validated scientific studies of the predictions of the GUTCP and RT/HH theory. Behind this strategy was the notion that the scientific community is driven by science, hence could be persuaded of the validity of the new model of quantum mechanics based on experimental tests, as well as demonstrated consistency with existing scientifically validated data.
In fact, it is clear my association with the company related to this strategy PLUS my willingness to conduct what all hoped would be impeccable studies designed to debunk the GUTCP, per Poppers’ Falsification Principle: only validated data that shows theory predictions are wrong can debunk.
Regarding my willingness to take on the task: apparently it was/is unusual. Indeed, on a BLP sponsored trip to Italy in 2004, I asked the business development chief of BLP: “Why me?” Answer: “We searched the world of scientists with a good reputation, willing and able to do the work, and it distilled to one person, you.”
Am I unusually brave? Reckless? Bored? Impressed by Randy? Just trying to do science as it is supposed to be done? Never figured it out…
J. Phillips, C. Chen, K. Akhtar, B. Dhandapani, and R. Mills, “Evidence of catalytic production of hot hydrogen in RF generated hydrogen/argon plasmas,” International Journal of Hydrogen Energy 32(14), 3010–3025 (2007).
J. Phillips, C. Kuchen, and R. Mills, “Evidence of energetic reactions between hydrogen and oxygen species in RF generated H2O plasmas,” International Journal of Hydrogen Energy 33(10), 2419–2432 (2008).
J. Phillips, and C. Chen, “Evidence of catalytic production of hot atomic hydrogen in RF generated hydrogen/helium plasmas,” International Journal of Hydrogen Energy 33(23), 7185–7196 (2008).
J. Phillips, “Selective atomic hydrogen heating in plasmas: Implications for quantum theory,” International Journal of Hydrogen Energy 34(24), 9816–9823 (2009).
A.V. Phelps, “Comment on ‘Water bath calorimetric study of excess heat generation in resonant transfer plasmas’ [J. Appl. Phys. 96, 3095 (2004)],” Journal of Applied Physics 98(6), 066108 (2005).
B. Lavrov, and A. Melnikov, “Spectroscopic determination of highly nonequilibrium velocity spectra of hydrogen atoms in H2 + Ne, Ar, Kr hollow-cathode discharges,” Optics and Spectroscopy, (1995).
M.R.G. Adamov, B.M. Obradovic, M.M. Kuraica, and N. Konjevic, “Doppler spectroscopy of hydrogen and deuterium Balmer alpha line in an abnormal glow discharge,” IEEE Transactions on Plasma Science 31(3), 444–454 (2003).
Z.Lj. Petrović, and A.V. Phelps, “Energetic ion, atom, and molecule reactions and excitation in low-current H2 discharges: Hα Doppler profiles,” Phys. Rev. E 80(6), 066401 (2009).
A.V. Phelps, “Energetic ion, atom, and molecule reactions and excitation in low-current H 2 discharges: Model,” Phys. Rev. E 79(6), 066401 (2009).
C.V. Budtz-Jørgensen, J. Bøttiger, and P. Kringhøj, “Energy spectra of particles bombarding the cathode in glow discharges,” Vacuum 56(1), 9–13 (2000).
E.L. Ayers, and W. Benesch, “Shapes of atomic-hydrogen lines produced at a cathode surface,” Phys. Rev. A 37(1), 194–199 (1988).
N. Cvetanović, M.M. Kuraica, and N. Konjević, “Excessive Balmer line broadening in a plane cathode abnormal glow discharge in hydrogen,” Journal of Applied Physics 97(3), 033302 (2005).
I. Bozhinova, A. Pashov, and S. Iordnova, “Experimental study of the evolution of the Ha line profile in a pulse hydrogen discharge,” J. Phys. D: Appl. Phys. 55 275203 (2022).
G. Baravian, Y. Chouan, A. Ricard, and G. Sultan, “Doppler-broadened Hα line shapes in a rf low-pressure H2 discharge,” Journal of Applied Physics 61(12), 5249–5253 (1987).
C.-K. Chen, T.-C. Wei, L.R. Collins, and J. Phillips, “Modelling the discharge region of a microwave generated hydrogen plasma,” J. Phys. D: Appl. Phys. 32(6), 688–698 (1999).
C.-H. Chou, T.-C. Wei, and J. Phillips, “Detailed model of the afterglow region of a microwave generated oxygen plasma,” Journal of Applied Physics 72(3), 870–878 (1992).
T.-C. Wei, and J. Phillips, “Transport model of charged particle behavior in the afterglow region of a microwave generated oxygen plasma,” Journal of Applied Physics 74(2), 825–831 (1993).
T. Wei, L.R. Collins, and J. Phillips, “Measurement and modeling of N‐atom behavior in the afterglow of a microwave plasma,” AIChE Journal 42(5), 1361–1370 (1996).
J.A. Menéndez, L.R. Radovic, B. Xia, and J. Phillips, “Low-Temperature Generation of Basic Carbon Surfaces by Hydrogen Spillover,” J. Phys. Chem. 100(43), 17243–17248 (1996).
C.H. Chou, and J. Phillips, “Platinum metal etching in a microwave oxygen plasma,” Journal of Applied Physics 68(5), 2415–2423 (1990).
K. Akhtar, J.E. Scharer, and R.L. Mills, “Substantial Doppler broadening of atomic-hydrogen lines in dc and capacitively coupled RF plasmas,” J. Phys. D: Appl. Phys. 42(13), 135207 (2009).
R.L. Mills, P.C. Ray, R.M. Mayo, M. Nansteel, B. Dhandapani, and J. Phillips, “Spectroscopic study of unique line broadening and inversion in low-pressure microwave generated water plasmas,” J. Plasma Phys. 71(06), 877 (2005).
R.L. Mills, P.C. Ray, B. Dhandapani, R.M. Mayo, and J. He, “Comparison of excessive Balmer α line broadening of glow discharge and microwave hydrogen plasmas with certain catalysts,” Journal of Applied Physics 92(12), 7008–7021 (2002).
D. García-Alvarez, D. Jevremović, J.G. Doyle, and C.J. Butler, “Observations and modelling of a large optical flare on AT Microscopii,” A&A 383(2), 548–557 (2002).
Z. Svestka, “Spectra of Solar Flares,” Annu. Rev. Astron. Astrophys. 10(1), 1–24 (1972).
O. Kochukhov, S. Bagnulo, and P.S. Barklem, “Interpretation of the Core-Wing Anomaly of Balmer Line Profiles of Cool Ap Stars,” The Astrophysical Journal 578(1), L75–L78 (2002).
M. Gelbmann, T. Ryabchikova, W.W. Weiss, N. Piskunov, F. Kupka, G. Mathys, “Abundance analysis of roAp stars,” Astr. and Astrophys 356, 200 (2000).
R. Gardiner, F. Kupka, B. Smalley, “Testing convection theories using Balmer line profiles of A, F, and G stars,” Astr. and Astrophys 347 876 (1999).
A.F. Kowalski, J.C. Allred, H. Uitenbroek, P.-E. Tremblay, S. Brown, M. Carlsson, R.A. Osten, J.P. Wisniewski, and S.L. Hawley, “Hydrogen Balmer Line Broadening in Solar and Stellar Flares,” ApJ 837(2), 125 (2017).
B.A.H. De Maat, “Calorimetric and Spectroscopic Measurements on DC Discharge Plasmas Containing Hydrogen,” Eindhoven University of Technology, M.S. Thesis 2009 (https://pure.tue.nl/ws/portalfiles/portal/46931320/757950-1.pdf )
J.M. Brown, D.A. Jennings, M. Vanek, L.R. Zink, and K.M. Evenson, “The pure rotational spectrum of ArH+,” Journal of Molecular Spectroscopy 128(2), 587–589 (1988).
T.R. Hogness, and E.G. Lunn, “The Ionization Potentials of Hydrogen as Interpreted by Positive Ray Analysis,” Proceedings of the National Academy of Sciences of the United States of America 10(9), 398–405 (1924).
R. Güsten, H. Wiesemeyer, D. Neufeld, K.M. Menten, U.U. Graf, K. Jacobs, B. Klein, O. Ricken, C. Risacher, and J. Stutzki, “Astrophysical detection of the helium hydride ion HeH+,” Nature 568(7752), 357–359 (2019).
“The ‘Impossible’ Molecules That Only Appear In Space,” Discover Magazine, (2019).
A. Rathke, “A critical analysis of the hydrino model,” New J. Phys. 7, 127–127 (2005).
What is the imputed velocity imparted to the protons (hydrogen nuclei)?
What about Lyman alpha?