


The Hydrino Hypothesis Chapter 9
An Introduction To The Grand Unified Theory Of Classical Physics

This monograph is an introduction to Randell L. Mills’ Grand Unified Theory of Classical Physics, Hydrino science, and the efforts of the company Brilliant Light Power (BLP) to commercialize Hydrino-based power technology, as told by Professor Jonathan Phillips. Out of necessity, it assumes a degree of familiarity with physics and physics history. An overview of the BLP story which serves as a helpful introductory piece to those unfamiliar with its sweeping scope can be found here. Readers should also read the previous chapters of this monograph prior to this one:
Chapter 1 of The Hydrino Hypothesis
Chapter 2 of The Hydrino Hypothesis
Chapter 3 of The Hydrino Hypothesis
Chapter 4 of The Hydrino Hypothesis
Chapter 5 of The Hydrino Hypothesis
Chapter 6 of The Hydrino Hypothesis
Chapter 7 of The Hydrino Hypothesis
Chapter 8 of The Hydrino Hypothesis
By Professor Jonathan Phillips
Extreme Ultraviolet Spectroscopy All Consistent with HH Predictions
Preface: This chapter reviews features of the Hydrino Hypothesis (HH) that lead to the prediction of bands in the extreme ultraviolet (EUV) spectra unique to Hydrino plasmas, that is plasmas containing both atomic hydrogen and a catalyst species (e.g. Ar, He, H2O). Experimental outcomes are shown to be generally consistent with theory. EUV range spectral bands are observed in terrestrial plasmas containing hydrogen and helium (catalyst) at or near HH-predicted wavelengths. These bands are not observed in control plasmas of single gases EUV spectra quantitatively consistent with the HH are also observed in the interstellar medium (ISM) as well as from stars. In contrast to the HH’s prediction of EUV spectral bands in certain terrestrial plasmas, a review of the literature shows there are no conventional physics explanations for experimental observations. Similarly, astrophysical models of the observed EUV spectra in the ISM are many, inconsistent, and not predictive. Also, the conventional identification for EUV peaks in stars provoke more questions. In sum, the EUV astrophysics data is generally consistent with HH predictions, and conventional physics explanations are clearly post-observation fits with no predictive component.
Introduction
The GUTCP remains a viable quantum theory because using classical physics and no adjustable parameters it can be employed to make quantitative predictions that closely match thoroughly vetted observations, particularly spectral observations. In contrast, as shown in earlier chapters, SQM never directly predicts spectra, and at best can be employed, with multiple variable parameters, to fit observations. Still, as with all theories, the GUTCP’s continued ranking as a viable theory lasts only as long as predictions based on the theory match new challenges.
In this chapter we explore predictions of the GUTCP and associated HH regarding the most radical prediction of the atomic component of the theory: spectra in the EUV that are consistent with a two-step mechanism for the formation of Hydrinos, a form of matter not accepted in the mainstream scientific community. The HH predicts, quantitatively, the experimental signature produced by each step in the Hydrino formation process.
In the previous chapter the “signal” produced in the first step was the focus. In this chapter, the spectral signals associated with the second step in the Hydrino process is the primary focus. Specifically, the HH predicts the following phenomena as a result of the second step of Hydrino formation:
The existence of specific wavelength bands of very high energy continuum radiation in plasmas generated with mixtures of hydrogen and Hydrino catalyst species.
Line emission associated with matter in the close vicinity of the Step 2 process that is photoionized by this high energy continuum radiation.
It further predicts no such bands will be found in plasmas generated with any single gas, except pure hydrogen. Note, given the very limited Balmer line broadening observed in pure hydrogen the EUV spectra from pure hydrogen is anticipated to be very weak.
In contrast, conventional physics predicts only the typical single wavelength line emission associated with excited states will exist in these mixed plasmas. There are no predictions in the standard paradigm physics of high energy continuum radiation bands resulting from any interaction between species in any of the mixed gas plasmas described below. Hence, the observation of extra lines/bands at the positions predicted is yet another powerful demonstration that the HH remains a valid model, and standard paradigm models are less viable.
HH Predictions for Catalyst and Hydrogen Gas Mixtures
The HH, per the Source Text, predicts that in terrestrial plasmas containing hydrogen atoms and catalytic species (e.g. H2/He, H2/Ar, H2O), there will be spectral “bands” resulting from the second step in Hydrino formation, that is, the drop in energy occurring during the transformation of a transition state to a stable Hydrino.
The upper energy limit/minimum wavelength of these continuum radiation bands is a value which can be computed using the GUTCP. The deeper the final Hydrino state formed, the shorter the minimum wavelength of the band. For simplicity these minimum band wavelengths will be called low edge wavelengths.1
Brief Review of the Hydrino Hypothesis
A brief review of the theory provided in the HH chapter is needed to understand the proposed mechanism for spectral band generation, and what low-edge wavelengths of specific bands are anticipated.
As noted in the earlier chapters, Hydrinos form in two steps. The first step is a process called Resonant Transfer (RT) in which the electron in a hydrogen atom drops by a multiple of one Rydberg (27.2 eV) into a transition state. The energy of that transition does not result in a photon emission. Rather, the energy is transferred, as required by the classical physics law of energy conservation, i) to a catalytic atom, or molecule, leading to its ionization, or ii) through a secondary process, into the kinetic energy of two hydrogen atoms, or iii) shared (requires momentum conservation) and atomic hydrogen, and one distinct molecule (e.g. argonium per Author’s Concerns section, Ch. 8).
Lest there be any confusion, it is re-iterated the first step does not directly produce novel spectroscopic lines, however; in some cases, the RT process will be followed, nearly instantly, by a photon-producing process: the Hydrino catalyst, ionized by the energy transfer from hydrogen, recaptures an electron generated. The spectral lines thus produced are not novel but rather those of the ionized catalyst species.
Also, as discussed at length in the preceding chapter, the first step can modify the nature of Balmer series lines of atomic hydrogen. Specifically, it can lead to Balmer series line broadening, or even intensity “inversion” of the lines in a Balmer series (see Chapter 8).
It is only the second step in Hydrino formation that leaves unique spectral lines, that is, the theory predicts the production of wavelengths not associated with hydrogen or the catalyst. Moreover, the line shapes will also be unique due to a Bremsstrahlung-type process. The GUTCP employs this language: the electron accelerates from the transition state radius (a0) into a final stable Hydrino state radius (a0/n) where it has zero inward velocity.
This process is predicted to produce a Bremsstrahlung-type continuum radiation spectra that appears as a band rather than the standard discrete line emission associated with the transition from one energy state in an atom to another energy state (Figure 9-1).
It is worth noting that the theoretical model of the second step in Hydrino formation leading to spectroscopic band with a specific low edge wavelength, was a predicted outcome of Hydrino formation more than a decade prior to when Mills et al. actually tested the hypothesis. It is not a “fit” to the data.
Hydrino Formation In GUTCP Vs. Mod II
As presented in Chapter 7, there are differences between the standard GUTCP Hydrino formation process and this author’s Mod II modification.
For a quantum transition to produce a photon during the second step to the Hydrino state, either,
Per GUTCP: i) a trapped photon is present in the (Step I) transition state, ii) Bremsstrahlung radiation, an empirical description of the band of radiation generated during electron deceleration, is released (observable) during the deceleration of electron from the Transition State to the stable Hydrino state (Step II), and iii) a trapped photon remains in the final stable Hydrino state.
Per Mod II: i) there is no photon in the transition state, ii) Bremsstrahlung radiation is released (observable) during the deceleration of electron from the Transition State to the stable Hydrino state (Step II), iii) there is no photon in the final Hydrino state.
According to the GUTCP, photons are real, trapped bits of energy. In the Hydrino formation model presented in the Source Text, and in Mod II, in moving from the transition state to the stable Hydrino state, radiation energy is released. This energy, in both models, will equal that of the difference in energy between transition state and final Hydrino state. This energy will be specific, and predictable, and produce a spectral feature at wavelengths not (in general) associated with either hydrogen or the catalyst. Rather than a sharp spectroscopic line, the spectroscopic feature will be a wide band of wavelengths, as this is anticipated for accelerating or decelerating electrons, per the GUTCP description of the second step (Ch. 7).
It must be noted the energy balance in the GUTCP version is a bit complex because there is a “trapped photon” present in the transition state and in the final Hydrino state. Is the trapped photon energy in the Hydrino state the same as the trapped photon energy in the transition state? Not clear.
In contrast to the standard GUTCP model, Mod II postulates that after the RT step there is no trapped photon, so no photon can be released in the second step and there is also no photon in the final stable Hydrino state. The observed photon/radiation of the second step is created by the Bremsstrahlung process. The analogy is clear. High energy “naked” charged particles (e.g. in accelerators) that are suddenly stopped do not release “trapped” photons. There is no trapped photon/radiation to release. The photons/radiation is created by the acceleration process.
There is really no reason to belabor the difference between the two models. The difference may only be of interest to this author! The observable, Bremsstrahlung type radiation is the only observable in both models. It will have the same net energy and form in both models. There is no experimental data that can distinguish the two models. Both predict a spectroscopic energy band with net energy equal to the difference in energy between the transition state and the Hydrino state will be the only observable. (Note: it is a band, rather than a sharp spectroscopic line because the electron moving from the transition state to the final state will decelerate, and this will result in Bremsstrahlung radiation.)
In sum both models predict the observed behavior discussed throughout this chapter.
A final clarification/emphasis offered by this author: the Bremsstrahlung model of emission bands associated with electron stoppage, requires no trapped photon.
Bremsstrahlung
There is precedent for the suggestion that a high energy electron undergoing deceleration will produce a spectral band with a minimum/low edge wavelength that corresponds to the maximum energy change associated with the process. This type of process is frequently observed in particle accelerators and the name given to the name of the process is Bremsstrahlung, or braking radiation, and it is associated with a “band” in the spectra rather than a single line (Figure 9-1).

Figure 9-1: Bremsstrahlung Radiation- Note the following: i) the maximum energy position, Anchor Wavelength, does not correspond to the position of maximum peak/band intensity, ii) there is no “precise” band width in frequency space, but the band is always considerably broader than peaks formed from more standard processes, and iii) the band generally has a “hump” shape.
GUTCP RT Plasma Predicted Spectral Observations
The next issue in the model are quantitative predictions: what are the minimum wavelengths (highest energy) predicted? (Disclaimer: In the following, the answer to that question is an interpretation of the Source Text by this author. This is not an authorized interpretation.) This topic is discussed in Chapter 7, but a brief review offered here.
The wavelengths that are predicted correspond to energy difference between the transition state and the stable Hydrino state. The stable Hydrino states, according to GUTCP theory, fulfill this force balance:

as well as the standard momentum equation for electrons:

Once the radius and velocity are determined from these two equations, the net energy of the electron in the Hydrino state is computed, as previously, using standard classical physics:

There are at least two types of energy drop between the Transition State and the Hydrino State. The first type of energies are those in which an 1/ni transition state rapidly decays into a 1/ni Hydrino state where i the same for transition and Hydrino states. All of these energies can be derived from Table 9-1.

The second type of transition is from 1/nI transition states to any 1/nX Hydrino state, where I is not equal to X. This second type of transition is not mentioned in the Source Text. These transitions, per the modified model presented in Chapter 7, is permitted if the energy of the nX stable Hydrino state is lower than that of the parent transition state. The allowed transitions, and the resulting low edge wavelengths are listed in Table 9-2.

It is notable that these two tables predict these processes are able to produce low edge energies that are multiples of 13.6 eV, that is potential energy of release are 13.6 x 2, 3, 4, 6, 7, 8, and higher. Although Table 9.2 was limited to radiation released/detectable in the EUV, not every possible drop in energy leading to EUV radiation was considered. For example, disproportionation is not considered in the tables. Clearly, for example, this disproportionation reaction can occur:

And the energy released can show up as a photon of wavelength 45.6 nm. Hence, the missing multiples of 13.6 eV release may occur by some Hydrino formation mechanism not considered herein.
Indeed, in the Source Text it is asserted a Bremsstrahlung-type continuum radiation process releasing energy is anticipated for n x 13.6 eV where n can be any value <137. Table 9-3 was constructed on the assumption that one of the many mechanisms described earlier will generate all energies that are multiples of 13.6. Only the first fourteen predicted cut-off wavelengths are provided, but this is the table that will be used to assess the agreement between the predictions of the GUTCP and observations. In addition to the multiple of 13.6 eV energy releases, in the GUTCP two second order lines are also specifically called out, one at 20.3 nm (from line at 10.1 nm) and a second at 60.7 nm (from line at 30.4 nm).

Comparison with Data
BLP EUV Studies of RT Plasmas
Most of the terrestrial plasma data, but not all, in which lines observed in the EUV range are predicted by the GUTCP and its HH are found in published peer reviewed work conducted by BLP scientists. Notably, the equipment and scientific expertise employed in the BLP EUV studies were all of the highest caliber. (Nothing unusual or unscientific about in-house processes, and not a reasonable basis for conventional scientists to claim foul!)
Why is most of the data in-house? No scientists, no government agency, felt, nor currently feels, there was/is any basis or need for studies of the EUV spectra of mixed gas plasmas. EUV studies are difficult and expensive in terms of equipment, time, and expertise. These are not experiments undertaken on a whim, and unfortunately undertaking expensive tests designed to debunk the HH (and by extension, the GUTCP) will not win accolades from the community…particularly if they fail to debunk.
The fact that Mills et al. undertook studies of the EUV spectra of hydrogen/catalyst mixed gas plasmas is a testament to their scientific approach to the HH. That is, they designed and conducted experiments intended to debunk it. Indeed, in the absence of specific lines in the EUV from hydrogen/catalyst mixed gas plasmas, it could be considered debunked. Certainly, conducting hydrogen/catalyst mixed gas plasmas experiments elicited a great deal of breath-holding at BLP as the experimental results were collected and analyzed.
An early example of EUV studies of mixed gas plasma spectroscopy is shown in Figure 9-2 below.2 The plasma that produced the spectra must also be noted as it is clear that the EUV spectra of each plasma type is unique. For the data shown the key plasma parameters were: 2.4 GHz plasma (microwave), 85 W power, He/H2 mix 98/2. Ne/H2 mix 98/2, 1 and 20 Torr studies conducted.
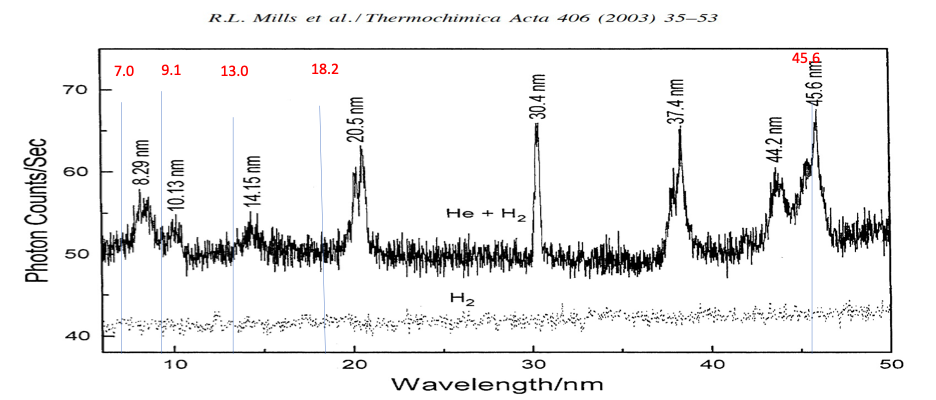
Figure 9.2: EUV spectra of He/H2 plasma- Lines corresponding to 13.6 eV x 2, 3, 5, 7, 10, and 13 are present (marked in red), and consistent with predicted radiation from Hydrino formation. That is, the anticipated wavelengths are at the high energy, shorter wavelength, end of the observed peaks. The line at 30.4 nm is possibly an overlap of a standard He line found repeatedly in pure helium plasmas and a HH-predicted emission. The lines at 37.4 nm and 44.2 nm are not anticipated directly by the HH but can be explained as resulting from a two-step process. Specifically, radiation produced by Hydrino formation is partially absorbed by electrons in helium atoms, leaving less energy, producing longer wavelength peaks, as described elsewhere (Ref. 9-2). Also note the spectra obtained with pure H2 gas (dotted curve) produced in the same instrument under the same conditions of power, pressure, etc. (From Ref. 9-2)
As predicted by the HH, the observed lines are quantitatively consistent with the energy changes anticipated for specific catalyzed transition state/Hydrino state processes (Tables 9-1, 9-2, and 9-3). As marked on the figure, the “mean” energy of the peaks in question is always a bit lower than the “predicted” energy, but this is anticipated by the nature of the predicted continuum radiation release. As discussed earlier, the maximum energy of the peak (shortest wavelength) should correspond to the full energy of the transition.
Another observation consistent with the HH predictions and at odds with the known spectra of helium are the absence (Fig. 9-3) in the H2/He mixed gas plasma of helium lines at ~25.7 nm and ~24.3 nm. These lines are observed in the pure helium gas plasma (Fig. 9-3), using the same equipment and operators. This suggests that the line at ~304 nm is the line predicted by the HH and is not a helium-generated line.
It should strike the reader that some lines, neither hydrogen nor helium lines, are present that are not identified with particular Hydrino transitions per Table 9-2. These lines can be explained assuming 2nd order processes, a concept fully accepted in the spectroscopy community.
Indeed, the lines at 37.4 nm and 44.2 nm are not anticipated directly by the HH but can be explained as resulting from a two-step process. Specifically, radiation produced by Hydrino formation is partially absorbed by electrons in helium atoms, leaving less energetic radiation, producing longer wavelength peaks, as described by Mills and others (Ref. 9-1, 9-3, 9-4).34 An excellent reference for following all the data and claims regarding which Hydrino formation EUV signals are observed can be found in Ref. 9-5.5
It is notable that the published manuscripts from BLP on the topic of EUV studies of helium/ hydrogen plasmas have extensive controls clearly showing that the extra peaks in the EUV spectra of H2/He are not associated with pump gases or impurities arising from any source.
For example, no hydrogen peak is observed in the wavelength range shown, from the same instrument (Fig. 9-2, dotted curve). If impurities were present, the identity of the primary gas would not eliminate peaks due to those impurities, hence one would observe the impurity lines in all gases, including pure hydrogen. As shown in Fig. 9-2, pure H2 case, no impurity lines are observed.

Figure 9-3: Control vs. Literature- The shortest wavelengths/highest energy emission for helium plasmas are shown on the left, A, B, and C. The same peaks are found in the control He plasma (light dotted curve on left) produced at BLP, A, B, and C. Pure hydrogen plasmas produce no peaks in this wavelength range. Hence, the extra lines found in the mixed gas plasma (left, and Fig. 9-1) cannot be explained except by some chemical interaction between hydrogen and helium (Ref. 9-2), i.e. Hydrino formation Step II.
It is also clear that the spectra of control plasmas, such as pure helium, match those found elsewhere in the literature (Fig. 9-3). Lines A, B, and C of that typical He spectrum match lines A, B, and C of the H2/He plasma and the pure He plasma. There are no other lines in recorded pure He spectra, that is, there are no lines for He, and certainly not for H2 at wavelengths below 15 nm. Hence, all the broad lines in Fig. 9-3 suggest an interaction between H2/He in the plasma that match, quantitatively, the predictions of the HH. Another type of control plasma substitutes a non-catalytic gas (Ne) for the catalytic gas (He) and notably there are no unidentified lines, no feature suggesting an interaction between neon and hydrogen, and no continuum radiation bands.
Another observation consistent with the HH predictions and at odds with the known spectra of helium are the absence (Fig. 9-3) in the H2/He mixed gas plasma of helium lines at ~257 nm and ~243 nm. These lines are observed in the pure helium gas plasma (Fig. 9-3), using the same equipment and operators. This suggests that the line at ~304 nm is the line predicted by the HH and is not a Helium generated line.
The extra lines observed in hydrogen/catalytic agent plasmas indicate some interaction must be taking place. Specifically, there are a multitude of high signal/noise lines that are not present in any of the control plasmas, that is, plasmas in which only one of the gases present in the mixed gas plasma is present. And, as noted, the HH not only predicts lines arising from an interaction, but the wavelengths at which these lines will be found. Near perfect match!

Figure 9-4: Exemplary Control Study- In this figure the EUV spectra of two gas mixtures, H2/He (top) and H2/Ne (bottom) (2%/98% in both mixtures) collected in the same device are compared. It is clear that in the Ne control all the expected Ne lines in this part of the EUV spectra are present, and none of the “extra” lines present in the H2/He plasma. Other controls behave as expected. For example, no lines were observed in this spectral range from a pure H2 plasma. (From Ref. 9-1)
Another type of control plasma supports this as well. The spectra of mixed gas plasma without a catalytic agent (e.g. H2/Ne) are simply a mix of the spectra of the individual gases. None of the “extra” HH-predicted lines of the H2/He plasma were observed by the BLP team in a H2/Ne plasma run in the same type of plasma, with the same instrument and same conditions (Fig. 9-4). This type of experiment also argues against “extra” lines being some sort of instrumental artifact.
And, as noted, the extra lines generated in H2/inert gas plasmas are not random but correspond precisely to energy levels predicted by the HH.
The EUV of other plasmas containing hydrogen and catalytic species were also studied at BLP, but to a lesser extent. Still, it is clear that in those plasmas there are extra lines in the EUV found at wavelengths in quantitative agreement with the HH model. For example, in pure H2 plasmas under specific conditions a singular definitive broad band consistent with predictions of the GUTCP was recorded (Fig. 9-5). The peak corresponds to a 54.4 eV photon, as predicted by a number of catalytic mechanisms of the HH.

Figure 9-5: Extra EUV lines in a pure H2 Plasma- Plasma generated with a high voltage (ca. 20 kV) pulsed discharge. Spectra collected with EV grazing incidence spectrometer. (From Fig. 10, Ref. 9-1).
Another observation made by BLP scientists is that the frequently observed ~22.8 nm peak found in catalyst/hydrogen mixtures is proportional in magnitude to the fraction of hydrogen in the plasma gas. This is an observation consistent with the HH but not with any standard model of plasma behavior (Fig. 9-6).

Figure 9-6: Continuum Broadening- Frequently observed broadening at approximately 22 nm increases with increasing hydrogen pressure, particularly in the event that electrodes employed can emit catalytic species. After Ref. 9-6.6
Other studies of the EUV spectra published by BLP teams in reviewed journals include Refs. 9-3 and 9-6. In those studies, it is clearly shown that the continuum is only observed in a plasma containing hydrogen and a catalyst. Careful controls show the continuum is never observed in those plasmas in which only a catalytic gas (e.g. pure He) is present.
Independent Studies of EUV RT Plasmas
As noted, earlier EUV studies are difficult, expensive and time consuming. It is not surprising EUV RT studies outside BLP are rare, but some exist. In particular, one MS student A.F.H. Van Gessel, Eindhoven University of Technology, undertook a EUV study of RT plasmas explicitly as a test of the reproducibility of the unknown EUV lines produced in-house at BLP.7 The outcome: within the limited wavelength region tested, all results were entirely consistent with the in-house findings of BLP scientists. In essence, the effort failed to debunk the HH.
The work employed two different plasma types, an Evenson cavity microwave system (~100 W) and a pulsed (DC) discharge plasma (~13 kV pulses). As shown in Fig. 9-7 the microwave spectra were observed only from 47 nm to 67 nm. This range of wavelengths studied is far from the range in which most Step II peaks are anticipated (e.g. Fig. 9-2).
Indeed, in the range studied only one Step 2 peak is anticipated by the HH, and that peak was observed.
It is important to note this peak is not due to one of the primary HH peaks listed in Tables 9-1 and 9-2, but is a secondary peak attributed by Mills to H(1/3) Hydrino formation releasing a 40.8 eV photon, and that photon subsequently interacting with a helium atom and losing 21.2 eV. This will create a spectral line with a wavelength of 63.3 nm, as observed. This line is found in the in-house BLP studies, as well as in spectra of ISM as discussed below.
As noted in the MS thesis, no conventional explanation for this line is known. Very complete control studies were performed, and in no case, except for the H2/He mixtures, was this line observed.
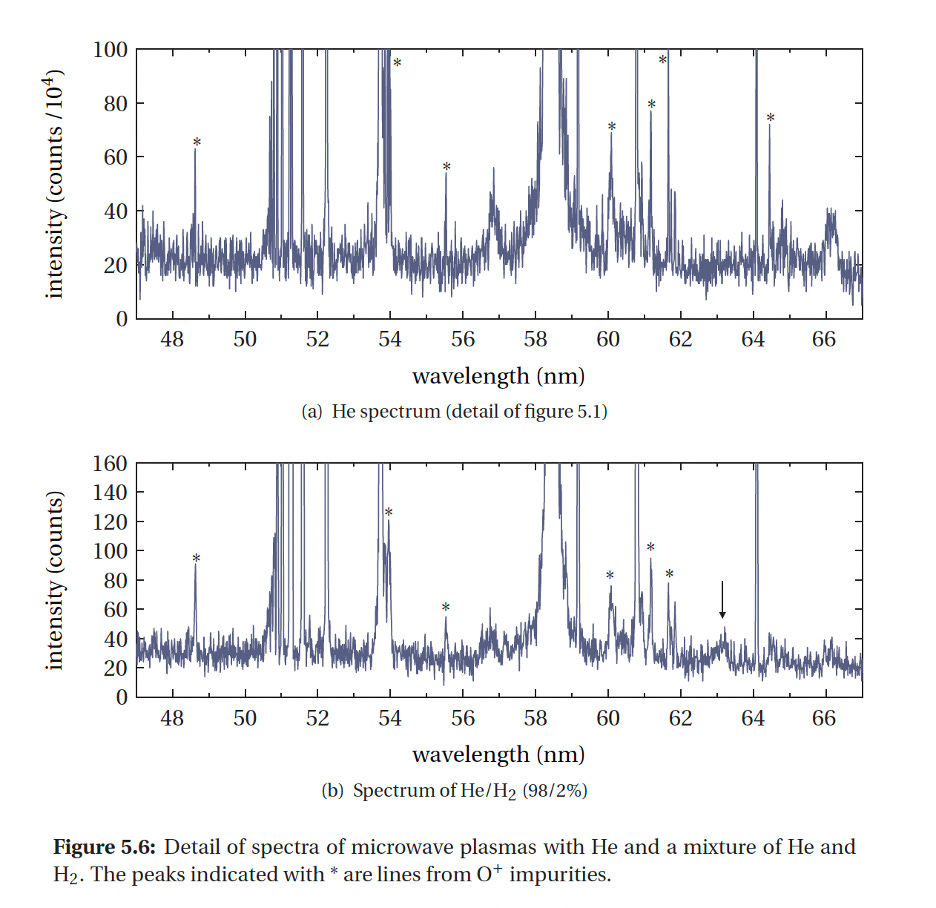
Figure 9-7: EUV Spectra for Mixed He/H2 (98%/2%) Plasma. The EUV spectra of only a limited wavelength range was reported, yet the one peak predicted by the HH was observed, arrow at ~63.5 nm. (After Ref 9-7)
A second example of a peak predicted by the HH, but totally unanticipated in conventional physics is a line observed at ~21 nm in the pure hydrogen pulsed plasma studied at Eindhoven (Fig. 9-8).
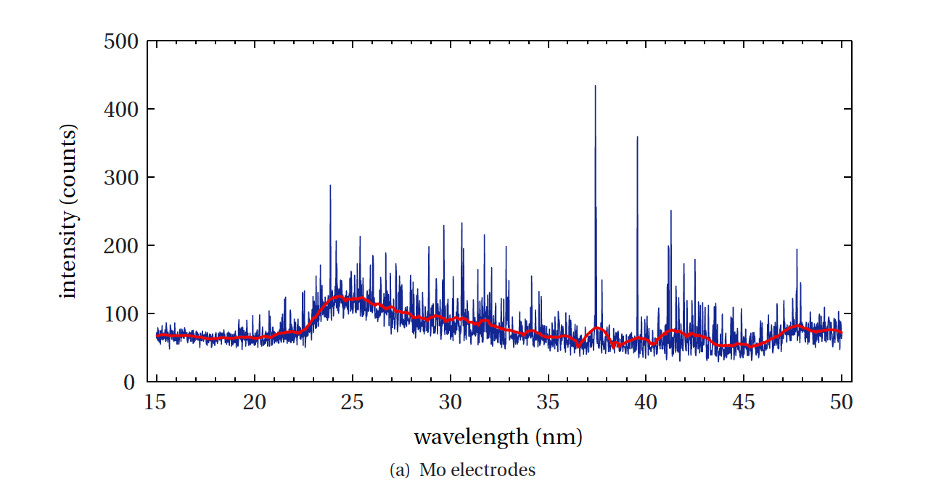
Figure 9-8: Pulsed Plasma with Pure Hydrogen- The same line observed in pure H2 by the Mills team (Fig. 9-5) was observed in Eindhoven lab. Alternative explanations to that presented by the HH include possible metal contamination from electrodes with these atoms having a very high degree of ionization, but these were considered highly unlikely. (Ref. 9-6)
It is disappointing to report that although Van Gessel reported results for pure hydrogen plasmas in the frequency range where signals from Hydrino formation are predicted, no report on mixed RT plasmas (e.g. H2/He) was provided. It appears no experiments on these mixed gas plasmas was conducted.
SQM theory of EUV Plasma Spectroscopy
In clear contrast to the HH, the standard quantum theory predicts no lines other than those known to be present in the spectra of the individual gases should be observed. There is no mechanism for creation of new quantum states/emission wavelengths arising from mixing these gases in a plasma according to standard theory. Yet, spectral lines which do not belong to any of the pure gases are observed. No standard physics model exists to explain this observation.
Astrophysical Data Comparisons
EUV Emission Of The Sun
According to the HH, Hydrinos should be forming in parts of the corona, and near the coronal/surface boundary, basically at any location where helium and hydrogen atoms co-exist in sufficient concentration. As the surface of the sun and the corona are primarily composed of helium and hydrogen, evidence of Hydrino formation is expected. Indeed, the HH predicts that the plasma zone around the sun could be responsible for a considerable fraction of all the conversion of hydrogen to Hydrinos.
As will be explored in Ch. 11, Hydrinos produced from H atoms by stars are, according to the GUTCP, the material currently known as “dark matter.” This Hydrino production process is also held responsible for the Balmer line broadening observed in a number of star-types, as discussed in the previous chapter.
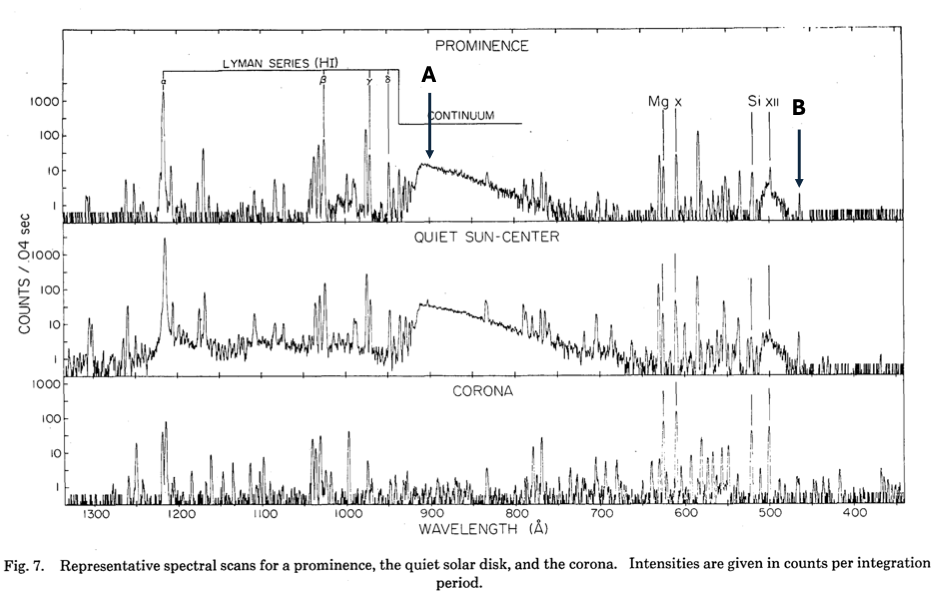
Figure 9-9: Study of the Solar EUV Spectrum Using a EUV Spectrometer in Earth Orbit on Skylab- Light from a particular solar feature was focused on the spectrometer using an on-board reflecting telescope. No interpretation of the spectra was provided. It is evident that the “continuum” features are only present in the spectra recorded from the solar surface and from a prominence (prominence: large plasma and magnetic field structure extending outward from the sun's surface, often in a loop shape), whereas most other features are present from all areas of the sun. This suggests the instrument is functioning and that the continuum recorded are real, not artifacts. Note, the large continuum neatly matches the 13.6 eV (91.2 nm) peak predicted (A) in GUTCP, and the shorter wavelength, smaller continuum (~51-48 nm), nearly matches the predicted 27.2 eV (45.6 nm) photon (B) predicted by the GUTCP, Table 9-3. (Figure After 9-8)8
Dr. Mills et al. (Ref. 9-3) make offer a great deal of commentary on Fig. 9-9, including the following:
The 91.2 nm continuum to longer wavelengths is expected to be prominent (less attenuated than the 10.1 nm and 22.8 nm bands) and is observed in the solar extreme ultraviolet spectrum as shown… despite attenuation by the coronal gas. High-energy photon excitation is more plausible than a thermal mechanism with T ∼ 106 given the 5,800 K surface temperature and the observation of the CO absorption band at 4.7μm in the solar atmosphere wherein CO cannot exist above 4,000 K.
Some clarification will be useful to the reader. (Question: why is the comment somewhat “oracular?” Perhaps deliberately obscured in order to avoid alarming the reviewers? Given the usual reaction to anything GUTCP by reviewers, this would be a reasonable strategy.)
The key points can be translated thus: attributing the big continuum feature as resulting from Hydrino formation makes a lot more sense than insisting that the corona is at more than 106 K. In particular, the widely accepted notion that the corona is super-hot is inconsistent with a lot of data showing CO, H2O, and other molecular species are present on the solar surface.
Indeed, all these molecules have relatively low (ca<5,000 K) decomposition temperatures, and clearly would be absent in any body at 106 K. In sum, only highly ionized single atom species are possible at 106 K, and not, as observed, molecular species.
Moreover, as pointed out in this reference and others by Dr. Mills, requiring the corona to be superhot (ca>106 K) as posited by most of the astronomy community, is a violation of the second law of thermodynamics. That is, how can a body at 5,000 K (the solar surface) heat another body (corona) which is claimed to be 20 times hotter? According to the second law of thermodynamics, heat always moves from the hotter body to the colder body, due to the requirement that net entropy always increases. More on this issue is found in Ch. 11.
There are several difficulties with interpretation of solar EUV information. One is that there is not always a clear case to be made for the origin of all the signal. Is it all from the corona? How much is from the solar surface? The authors of corrected/synthesized from multiple source solar data (Fig. 9-10) exercise caution in this regard, suggesting that the data is “primarily” from the corona.
A second difficulty is that the data sets do not cover the same region of wavelength, e.g. compare Figs. 9-9 and 9-10 wavelength regions.

Figure 9-10: Corrected Solar EUV Spectra from 17.5 to 35.0 nm- Only one of three He II lines is observed, making the assignment of the line at ~30.4 nm to He II problematic. Possibly three of the four HH-predicted lines are present. The HH does not predict every possible Step II transition will occur; hence, a missing transition is not a meaningful criticism of the HH. (After Ref. 9-9)9
The data in Fig. 9-10 is data “synthesized” and corrected to account for all imperfections of the several platforms/spectrometers employed, thus is alleged to show true relative intensities of all peaks. This carefully corrected and curated data does not overwhelmingly support either the standard model of the origin of the EUV lines, nor the HH model.
Regarding the standard model: if the peak at ~30.4 nm is from He II, why are the other He II peaks (ca. ~25.6 and 24.3 nm) missing? For example, as the 30.4 nm peak is enormous, and the He II line at 25.6 is listed in references at ~50% the intensity of the 30.4 peak, it should undoubtedly be clearly distinguishable. Another difficulty is the identification of the other peaks. For example, the very intense peak at ~28.4 nm is attributed to highly ionized iron. For the degree of ionization required, this means the iron ions are at ~3.3 million K (Fig. 9-11). Really? This issue is addressed again, in more detail, in Ch 11.
The fundamental critique of the model of ion temperature used to assemble Fig. 9-11 below is that the outcome defies common sense regarding thermodynamics and energy transport. The temperature of each ion type is distinct, yet all are present in the same plasma?
For example, oxygen ions, based on relative oxygen ion line intensity, are fitted to be between 100,000 to 250,000 K, whereas iron ions are assigned temperatures of between 3,000,000 K and 3,250,000 K. In terrestrial plasma modelling, which agrees closely with data, it is sufficient to assume electrons are at one temperature and all other species, ions and neutrals alike, are in equilibrium at a different, and far lower, temperature.101112131415
There is great danger, as possibly done in this case, in simply accepting whatever a model program spits out. Scientific malpractice? A commonsense critique of multi-ion temperatures, such as that shown in Fig. 9-11, is in order.
The data are not fully aligned with the predictions of the HH either. Still, there is enough overlap to suggest the HH model is viable. For example, the grand peak at 30.4 nm (Fig. 9-10) is predicted by the HH, as are the failure for the secondary He II peaks to be present. Indeed, according to the HH, those peaks should not be present if the 30.4 nm (a.k.a 304Å as shown in some figures) line is from Step II of Hydrino formation. Also, at least two of the other HH-predicted peaks appear to be present. Yet, there are many, relatively small, peaks that the HH alone cannot explain. The reader is urged to contemplate the data.

Figure 9-11: Computed Temperatures of Ions in Solar Corona Based on Spectral Peak Intensities. Note lack of self-consistency: oxygen species temperatures are computed to be in a range from 100,000 to 250,000 K range, whereas from the same solar plasma iron species computed temperature is in the 1,000,000 to 3,250,000 K range. Other species are in unique temperature ranges as well. (After Ref. 9-9)
Other Stellar EUV Data
There exists a limited catalog of stellar EUV data collected with orbiting telescopes.16 The true validity of the data may give pause as the areas studied generally are large, encompass several stars, and may be subject to distortion by processes between stars and observer. (One model of a potential significant distortion is provided in the Personal Comments section at the end of this chapter.) Below an attempt is made to determine if the data supports, or in any fashion contradicts, the HH model predictions for spectra to be observed during the second step of formation of stable Hydrinos. The bottom-line-up-front (BLUF): the data neither contradicts, nor fully supports, the HH predictions. It is also clear that the conventional identification of many of the lines in EUV spectra of stars is questionable. A full explanation of all the lines found in the EUV of stars is yet to be developed.
As shown in Fig. 9-12 below, the EUV spectra of virtually all stars contains a strong emission at about 30.4 nm, which is both the strongest line in i) pure He spectra and the emission most likely to be found, and ii) experimentally (Figs. 9-3 and 9-4) from a plasma containing both hydrogen and helium.

Figure 9-12: EUV Spectra of Three Stars from 15.0 - 35.0 nm- As the red dot lines show, not all the lines from pure He are present in all stars; moreover, the absent lines (Algol and 31 Com) are the same as those missing from terrestrial H2/He plasma spectra (Figs. 9-3 and 9-4). The spectra also suggest only a few of the HH-predicted lines: 30.4 nm and 15.2 nm are consistently present. (Star types: Procyon- binary F5 giant, Algol-K- giant, 31 Com- yellow giant). (After Ref. 9-16)
The universal existence of the 30.4 nm emission line could be employed as evidence that the conventional model, that is spectral lines are from helium in this wavelength region are from helium, is sufficient. Thus, it could be argued there is no need for the HH model to explain the spectra found in Fig. 9-12; but, the conventional hypothesis “helium spectra explains all lines in the 15.0 - 35.0 nm region” hypothesis is flawed.
Indeed, it is clear that emission lines at ~25.6 and ~24.3 nm are always present in the spectra of pure He terrestrial plasmas, yet these are not present in the emission of many stars (e.g. Algol and 31 Com). It is notable that these lines are also missing from a terrestrial plasma containing both hydrogen and helium (Fig. 9-3).
The problem is the following: the HH model lines predicted to be found in this wavelength region, and found experimentally in terrestrial H2/He plasmas, are also absent. In particular, in many stars there is no line at ~22.8 nm despite the fact that this line is found in terrestrial H2/He plasmas.
In sum, neither the conventional model, nor the HH model, perfectly predict the observed stellar spectra in the 15.0 nm to 35.0 nm range. Yet, there is not enough evidence to reject either model based on this EUV data.
Next, consider the EUV spectra from ~7.5 to 17.0 nm/~75 Å to 170 Å as shown below in Fig. 9-13. There is no definitive agreement between HH predictions (blue dashed lines, Fig. 9-10) and the spectra; although it is not unreasonable to suggest that as these HH lines are continuum radiation emissions, lines with maxima only 0.3 nm to the low energy (right as shown) side of the GUTCP marked/predicted lines at 10.1, 11.4, and 13.0 nm are broad GUTCP lines. This degree of “off set” is similar to that seen in Fig. 9-2. Let the reader consider.

Figure 9-13: EUV Spectra of Three Stars from 8.0 - 16.5 nm- The red dashed lines show that the identification of many of the lines as generated from various Fe ions capturing electrons and emitting photons fits many, but not all, the lines in this wavelength regime well. In contrast, except for the observation of weak lines at the HH-predicted ~15.3 nm there is really no match. That is, HH predictions are not born out in this wavelength regime for these stars. (V711Tau- CVn binary; s2CrB – binary dwarf stars; Capella- 4 star cluster, two yellow giants and two red dwarfs) (After Ref. 9-16)
An alternative, and currently conventional, interpretation of all the lines shorter than 14 nm wavelength is that they are due to various highly ionized iron species. Indeed, three of these presumed highly ionized iron lines are marked on the figure (red dash), and the agreement is excellent. In fact, most of the Fe-ion assignments match peaks very well. (Not all peaks are marked as that would obscure the key features of the figure.) There are four large problems with these assignments:
Why would stars have this much iron in the surface?
Why would a star surface be at more than a million degrees (Fig. 9-11), as required to create iron in so highly an ionized state as claimed? As noted earlier, the presence of molecular species in star surfaces indicates they are at least two orders of magnitude cooler than required. All other measures, such as the determination of temperature from radiation spectra, are in full agreement with the temperature being of the order 5000 K.
Why do some stars have all the helium lines, and others not (Fig. 9-12)? Why do the assigned iron ions species differ from star to star (Fig. 9-13)?
As discussed below for interstellar media (ISM) there are proposed to be iron and oxygen lines from ISM. Coincidence with star data, or possibly “star” data also includes some EUV from material between earth and star? In sum, there are major inconsistencies between data and standard scientific logic (e.g. thermodynamics, consistency, expected star composition, etc.) in the standard model.
The Interstellar Medium
One of the many unsolved issues in astronomy is the source of soft x-ray/EUV radiation observed emanating from the ISM, or possibly the heliosphere boundary. This is a massive issue, hence only some aspects pertaining to the predictions of the HH are reviewed. In particular, the HH and observations of low temperature, highly diffuse terrestrial plasmas (above) suggest that spectral lines arising from postulated Hydrino formation EUV lines might be anticipated in the spectra of ISM. That is, the starting position for the HH is to assume that the ISM consists largely of helium and hydrogen, is presumably not very hot, and clearly extremely diffuse (generally assumed to be of order 1-10 particles/m3), and is qualitatively similar to terrestrial H2/He plasmas. Given this similarity, both are predicted to generate Hydrinos, hence similar EUV spectra.
The HH prediction, backed by data, as discussed below, is unsurprisingly not adopted, and not even acknowledged, by mainstream astronomy. In brief, mainstream astronomy attributes the observed lines in EUV of the ISM as arising from superheated gas.
The commentary on this issue is somewhat confusing, hence herein we reproduce a couple of the most coherent, and exemplary, analyses from senior astronomers in the field of ISM. From Rocchia et al.:17
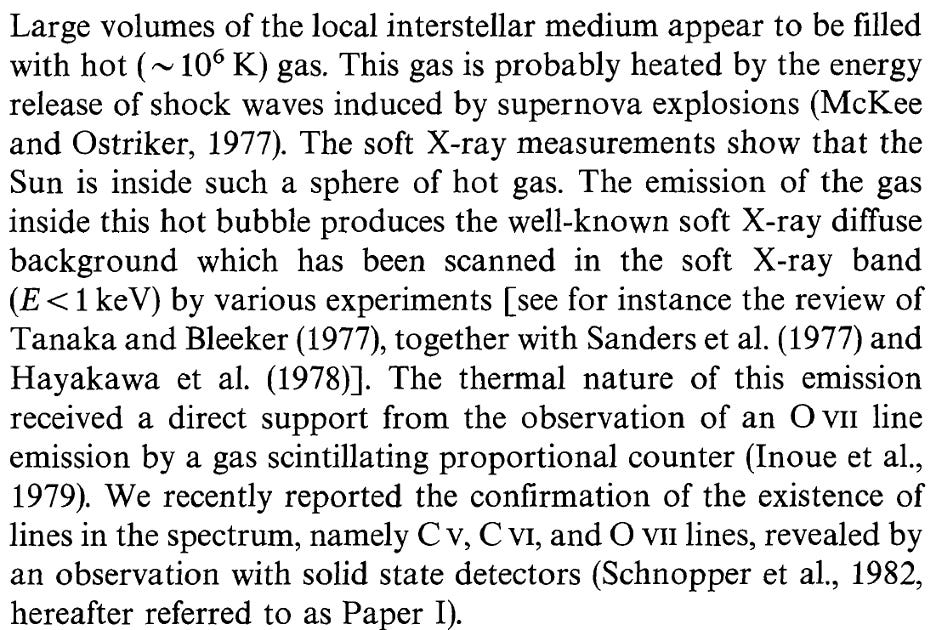
The above is totally consistent with the general understanding that the ISM is >99% gas, almost entirely hydrogen with some helium, very diffuse (nine or ten orders of magnitude less dense than earth atmosphere at sea level), and the gas, or at least a large part of it, is very, very hot. The basis of the temperature analysis are lines, repeatedly observed, in the EUV spectra.
As noted above, these lines are generally associated with highly ionized oxygen, carbon, and sometime iron. It is not associated with the 99+% of the ISM which is helium and hydrogen as the observed lines are shorter/higher energy than any associated with those gases.
The ISM temperature is assigned on the basis of the existence of these, presumed, oxygen, carbon and iron ions. It is concluded that these ions are formed via thermal equilibration with the cloud. To create these ions the ISM must have, at least in part, an equilibrium temperature in excess of 106 K. In particular for this essay, it is important to repeat that the temperature estimates are based solely on the assigned atomic source of particular spectral lines. There is no independent measure of temperature.
Below is a summary analysis from Lebov and Boyer, two astronomers with impeccable credentials, as they conducted the first studies of EUV by sending rockets outside earths’ atmosphere (Ref. 9-4). No EUV data was available prior to their pioneering work because EUV radiation is absorbed by the atmosphere, hence cannot be observed with terrestrial instruments.
Other features observed may originate in a hot ionized interstellar gas, but if this interpretation is correct, gas at several different temperatures is present. The strongest of these features is consistent with O v emission at 630 Â. This emission, when combined with upper limits for other lines, restricts the temperature of this component to 5.5 < log T < 5.7, in agreement with temperatures derived from O vi absorption studies…. Alternatively, if the O v emission covers a considerable fraction of the sky, it would be a major source of ionization. A feature centered at about 99 Â is well fitted by a cluster of Fe xvm and Fe xix lines from gas at log T = 6.6-6.8. These results are consistent with previous soft X-ray observations with low resolution detectors. A feature found near 178 Â is consistent with Fe x and Fe xi emission from gas at log T = 6; this result is consistent with results from experiments employing broad-band soft X-ray detectors.
Once again, a temperature model based on the EUV spectra of an astrophysical body requires different temperatures for different ions. Moreover, in the case of ISM it requires the complete abandonment of the historic, and reasonable, assumption that ISM is cold, that is of the order 3 K.
The best summary of the relevant ISM EUV spectra from the astronomy community is presented in Table 9-4:
Table 9-4 (After Ref 9-4)

The data in this table gives rise to this question: what if the standard explanations are fundamentally wrong? What if the ISM is not at all hot, and the spectra do not arise from extreme temperature induced ionization, but rather via Hydrino formation?
Is it really plausible to explain the high temperatures with shock waves? In an otherwise very low temperature environment (e.g. 3 C deep space) a hot body/cloud will cool to ambient in a matter of minutes via radiation.
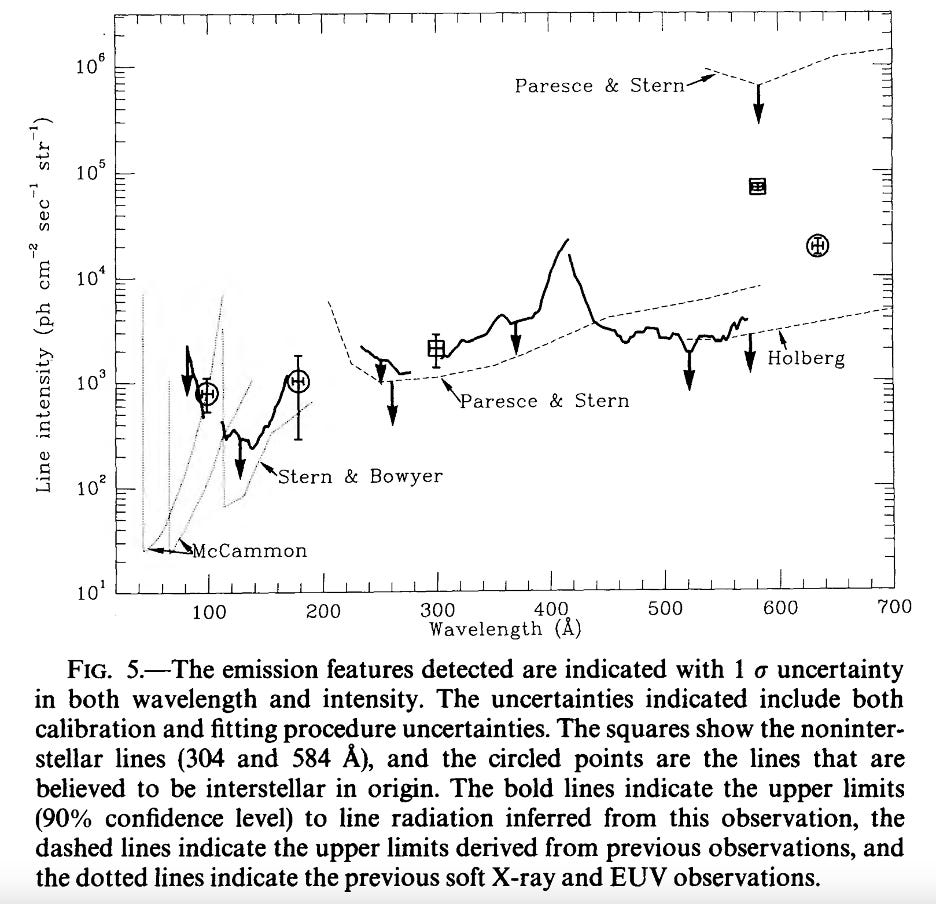
Figure 9-14: High Degree of Certainty- The data shown summarizes much of the key ISM findings for EUV studies of ISM. There is significant agreement among all studies. Notably the major identified lines, has sufficient signal/noise ratio to be considered highly certain to be signal. These primary findings were clearly not anticipated. For example, for wavelengths less than 30.4 nm (HH or just He), all lines appear to be from iron at one temperature range (ca. > 106 K), and oxygen at a far lower temperature (ca. >105 K). Neither the high temperatures required nor the very different temperatures for different species were anticipated. Not noted by these workers is the similarity of the ISM spectra to EUV spectra collected from stars, as described in the previous section. (After Ref. 9-4)
Clearly, there is good, but not perfect, quantitative agreement between the EUV data from the Hydrino formation energy range, specifically only lines A-D in Table 9-4, and the GUTCP predictions. Thus, it is concluded that EUV spectra collected from extremely thin material clouds (1 to 10 particles/m3) are quantitatively consistent with the HH. Specifically, it predicts that, like terrestrial plasmas, a gas mixture of hydrogen and helium in space will lead to the formation of Hydrinos, and concomitantly generate the spectral features reported in Table 9-3.
Once again, the HH survives. It is not debunked by the data.
The postulate that the data supports the HH predictions is further strengthened by details of the complexity of the alternative interpretation of the cosmos EUV spectra.
Table 9-5 (From Ref. 9-3)

To review, these are the main features of the standard “hot gas” model, which has a multitude of difficulties:
There are regions of the ISM that are very hot, from hundreds of thousands of degrees to millions of degrees K.
Temperature varies significantly from place to place, or perhaps from ion type to ion type, within the clouds.
The clouds contain significant quantities of species with large nuclei like oxygen, carbon, and iron.
Each “difficulty” is now considered in more detail. The first requires an explanation for the observed temperature. Clearly fusion, which is theorized to be the heating mechanism at the core of healthy stars, creating a pressure that balances the gravitational forces that would cause stars to collapse, is not possible in the rarefied (<10-8 atm. pressure) gases that compose ISM.
It is thus necessary to speculate on meta-physical mechanisms for “heating” this incredibly diffuse clouds to temperatures orders of magnitude hotter than the surface of the sun.
The earliest meta-physics model, one often cited (Ref. 9-17), advanced to explain the presumed high temperature is that the ISM is heated by shock waves generated by supernova. Yet, this seems an odd notion as hot gases, terrestrial or ISM, cool by radiation at a rate proportional to temperature to the fourth power (T4). What does this imply about the temperature of bodies briefly heated to very high temperatures by shock processes?
One example: radiative energy loss at night to the cool background of space that leads to deserts, which have no overhead clouds, cooling very rapidly at night. Perhaps a more relevant example of rapid cooling following a high energy “shock” is that of the atmosphere following a nuclear blast. Specifically, a nuclear weapon explosion creates by a shock wave and subsequently extremely high temperature gas; however, the gas cools to near ambient temperature with the passing of the shock wave in seconds.
The process of radiative cooling is independent of the atmosphere. It happens across a vacuum, or through a gas atmosphere with the same speed. A body heated by shock waves to millions of degrees, will like a desert, or the site of a nuclear blast, cool very, very quickly via radiation. In conclusion: in the absence of a constant source of heating, the ISM should not be hot.
The shock wave heating hypothesis is simply the flavor of the moment. There have been numerous alternatives offered over the last four decades. As discussed elsewhere, these include friction heating by gravity waves as ISM is subjected to shearing as stars pass close by, gravitational collapse of stars, stellar winds, and magnetic waves created by supernova remnants.1819
Clearly, all these models can be classified as border-line metaphysical conjectures. All of them sound a bit like the “science” of Dr. Spock in the original Star Trek series.
A succinct comment by Mills et al. regarding the consistency of observations with the HH is found here, and partially reproduced below (Ref. 9-1):
The first soft X-ray background was detected and reported about 25 years ago. Quite naturally, it was assumed that these soft X-ray emissions were from ionized atoms within hot gases. Labov and Bowyer also interpreted the data as emissions from hot gases. However, the authors left the door open for some other interpretation with the following statement from their introduction: “It is now generally believed that this diffuse soft X-ray background is produced by a high-temperature component of the interstellar medium. However, evidence of the thermal nature of this emission is indirect in that it is based not on observations of line emission, but on indirect evidence that no plausible non-thermal mechanism has been suggested which does not conflict with some component of the observational evidence.” The authors also state that “if this interpretation is correct, gas at several temperatures is present.” Specifically, emissions were attributed to gases in three ranges: 5.5 <log T < 5.7; log T = 6; and 6.6 < log T < 6.8. Recent observations in the ultraviolet with HST and FUSE and also XMM-Newton confirm these extraordinary temperatures of diffuse intergalactic medium (IGM) and reveal that a large component of the baryonic matter of the universe is in the form of WHIM (warm-hot ionized media). The mysteries of the identity of dark matter, the observed dark interstellar medium spectrum, the source of the diffuse X-ray background, and the source of ionization of the IGM are resolved by the formation of hydrinos that emit q · 13:6 eV emission, EUV and X-ray continua depending on the state transition and conditions, a 63.3 nm line, and pump the helium ion lines such as the 30.4 nm line. That the same transitions occur in stars and the Sun as evident by corresponding continua and line emission in its spectrum resolves the solar corona problem, the cause of sunspots and other solar activity, and why the Sun emits X-rays.
Conclusion
The scientific process, as noted earlier, indicates that if two theories predict clearly different outcomes, and only one is consistent with observation, then only that model remains validated. The preponderance of the imperfect data available suggests the HH model remains validated, and the standard model needs a great deal of tweaking. Indeed, the EUV studies of terrestrial H2/Hydrino catalyst mixed gas plasmas, and the EUV predicted lines in the spectra collected from the ISM are solid support for maintaining the GUTCP as validated.
In contrast, the standard models contain no explanation for “extra” lines in mixed gas terrestrial plasmas, and offers only meta-physical models, that is untestable models, of the heating required for the generation of postulated ionic species in hot ISM. The data from stars is inconclusive for both models.
In terms of the scientific mantra central to this monograph: no EUV data debunks the GUTCP predictions, hence the GUTCP remains a valid theory.
All the EUV data cannot be predicted with standard models, hence the standard model based on EUV data alone is teetering on the designation of invalid. Moreover, some of the data from stars, including the sun, is remarkably similar to that obtained from ISM, suggesting that much of the astrophysical data in the EUV range is contaminated by material intermediate with the “targets,” whether stars or ISM.
Finally, in the Personal Notes section below one finds the Purple Haze Hypothesis (PHH) and the following statement: it is crucial to note: The PHH does have implications for using astrophysical data to “test” the HH. In short: forget about it! There is far too much uncertainty/complexity with the astrophysical EUV data to make it a real test of the HH. The HH can realistically only be tested with terrestrial plasmas. Fortunately, this can be done with readily available instruments and expertise.
Personal Notes
One: The Purple Haze Hypothesis
I have repeatedly observed in my career the phenomenon of the information “stove pipe.” For example, in writing a treatise on the subject of catalytic etching (T. C. Wei, and J. Phillips, “Thermal and Catalytic Etching: Mechanisms of Metal Catalyst Reconstruction,” Advances in Catalysis, 41:359-421 (1996)) I became aware that the chemistry of catalytic etching was essentially the same as the plasma processing etching employed in semiconductor production, and also essentially the same chemistry that results in the etching of some materials on satellites in low-earth orbit. We found each of the phenomenon noted above generated completely distinct scientific literatures. There was no cross referencing. None. Remarkably, we were apparently the first to be aware, and write, of this connection, and certainly the first to explain that all etching processes result from of the actions of chemical radicals! The data was “stove piped” by discipline.
A similar stove pipe issue was discussed earlier in this monograph regarding Balmer line broadening (previous chapter). As discussed, we were the first to consider line broadening observed in stars and in terrestrial plasmas as arising from the same source. Previously no cross-referencing existed.
It is contended herein that if all the data from various astrophysical disciplines was combined it would support the Purple Haze model outlined below.
It is crucial to note: the PHH does have implications for using astrophysical data to “test” the HH. In short: Forget about it! The HH can realistically only be tested with terrestrial plasmas. There is far too much uncertainty/complexity with the astrophysical EUV data to make it a real test of the HH.
The Purple Haze Hypothesis (PHH): The EUV light purportedly from stars and ISM primarily originates within the heliosphere.
It is not light coming from the accorded sources. This means, no matter where an orbiting telescope/spectrometer is pointed, it will observe essentially the same spectra.
This is in sharp contrast with the standard paradigm: a telescope /spectrometer is pointed at an object. All the detected “light,” from any part of the E and M spectra: RF, visible, IR, and EU, all light broken into its component parts by a spectrometer, is coming from that object.
The PHH says, Not So. Specifically, the observed EUV originates in the heliosphere, and not from the target star or interstellar cloud.
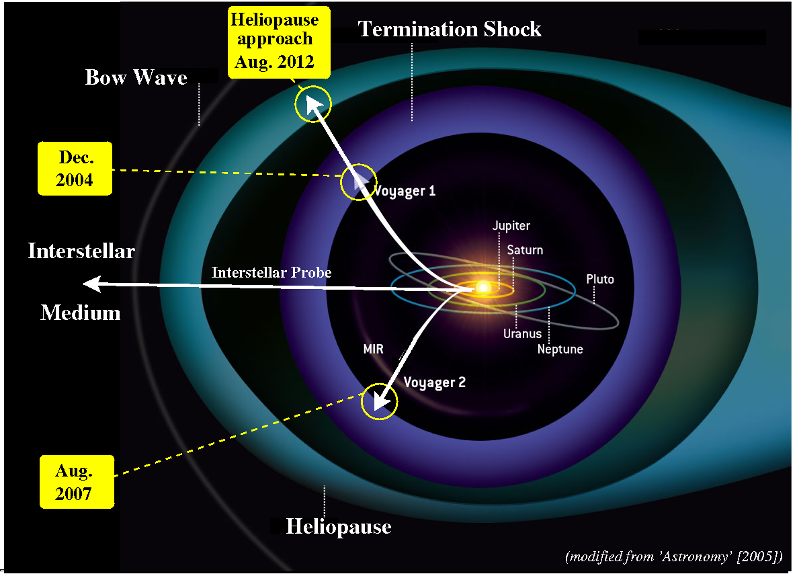
Figure PN-1: Heliosphere- Composed of “ellipses” of dramatically different “winds,” compositions, temperatures, etc.
The assumption that light originates from the object at which the telescope is directed is common sense. Indeed, it is clear in the visible E and M range this is true. Indeed, we look at the night sky and see blackness, except from individual points of light, that is, stars (or galaxies). It is deep common sense to conclude all astrophysical light is associated with dense objects that glow because they are hot…. The contention herein is that this common sense believe is not true for the EUV. Specifically, if our vision was attuned to the EUV and not the visible, above earth’s atmosphere we would see only a purple haze, everywhere. The sky would not be dark.
Below, concept which fill in the details of Purple Haze and data which support the hypothesis are examined.
Point 1
The data regarding the EUV spectra of stars and ISM reviewed in this chapter shows a remarkable, although clearly not exact, similarity for all known astrophysical objects. All, both stars and ISM, have one major helium, or Hydrino formation line, at ~30.4 nm. All show many low intensity lines that are remarkably well fitted by assuming they are produced by highly ionized iron or oxygen. Notably, the observed lines, except for the 30.4 nm line and a couple of others, are not consistent with the expectations of Hydrino formation. That is, there are GUTCP predicted lines missing at shorter wavelength in the EUV.
Remarkably, the similarity between ISM and star EUV data is stove piped. The two literatures do not cross reference.
Contention: these observations fit the Purple Haze hypothesis. Can it be that the light/signal analyzed in the EUV from stars and ISM be strongly similar? It is virtually impossible to create a rational explanation for the similarity between star and ISM EUV spectra. Shock waves anyone? In contrast, a test of the Purple Haze is to compare EUV signals from every random direction in the sky. If the EUV signal originates in the heliosphere, the apparent EUV spectra will be the same, regardless of the star at which the telescope is directed. So far, this model appears consistent with data.
Point 2
A big issue with standard models is the purported source of energy that creates the observed highly ionized iron and oxygen, particularly in ISM. As noted in the chapter, every existent “standard paradigm” model fails upon even the simplest challenges. For example, the “shock- wave-from-a-supernova” model of ISM heating was shown above to be questionable. Indeed, heating from a shock wave does not produce superhot material for a long period. Radiation cooling of extremely hot objects to a near absolute zero T background is very, very rapid. (Another model of heating, found throughout the astrophysics literature, “magnetic field collapse,” is discussed in Chapter 10. Therein it is noted that the collapse of a magnetic field is a “phase change,” similar to ice (magnetic field) melting (no magnetic field). It takes energy to affect this phase change. NO ENERGY is released!)
There needs to be an ongoing energy source to explain the observation of highly ionized species. And, it certainly clear that every star should show the same spectral lines as the ISM. Is it a serious proposal that every star was recently subjected to shock wave generated by a supernova?
Once again, the stove pipe issue is demonstrated. The two literatures, ISM EUV and Star EUV, do not cross reference. It appears that the star group scientists and the ISM group scientists are not aware that both suggest extreme temperatures explain the observed levels of oxygen and iron ionization. Neither takes note that the other suggests order of 10 times higher iron ion temperature than oxygen ion temperature.
Herein a source of energy is proposed, one consistent with the PHH: the formation of Hydrinos within the heliosphere, particularly deep Hydrino formation; that is n is >4 (aH/n), releases tremendous energy. The formation of Hydrinos is taking place throughout the heliosphere, or possibly only in particular regions. The photons from these deep Hydrino formation processes do not reach earth orbiting satellites, and hence the characteristic lines of deep Hydrino formation are not observed. Rather, the high photon energy released during Hydrino formation (Purple Haze) is absorbed by nearby iron, oxygen, etc. It is the absorption of this energy which leads to dramatic levels of ionization.
The absorption postulate is consistent with the general problem of observing EUV in terrestrial plasmas. EUV is very strongly absorbed by virtually every gas, liquid and solid; hence the alternative appellation for EUV: Vacuum Ultraviolet (VUV). In terrestrial studies it is known only that radiation generated in the EUV which traverses near zero pressure gas will reach a spectrometer. A very special high vacuum apparatus is required to observe EUV spectra.
The usual unstated assumption that the vacuum of space is sufficient to allow EUV to reach space just beyond our atmosphere. The PHH, supported by the same EUV signature from every corner, is that EUV from beyond the heliosphere does not reach instruments near earth. Although there is a very low pressure, it is not zero, and the cumulative impact of the vast distance between the stars and us is that there is sufficient net matter to absorb all the EUV generated from beyond the heliosphere.
Point 3
Another “odd” observation revealed by both star EUV observation and ISM observation are the different temperatures associated with different species. As noted in this chapter oxygen is generally found to be of the order of magnitude cooler (>100,000 K) than iron (>1,000,000 K). Does the Purple Haze Hypothesis provide an explanation? Possibly.
First note, the heliosphere is not uniform. Let us consider an analogy with another body not uniform in nature, one better studied: the aurora borealis (Northern Lights). In particular, the origin of the different colors observed, as discussed in this excerpt from the heliosphere entry on Wikipedia:

Different colors observed in the aurora borealis originate from different heights above the earth. In particular, different colors are associated with oxygen ions at different levels, and concomitantly different temperatures/ionization levels, above the earth (see Box 1).

Color is associated with temperature. Indeed, the basis of assigning iron ions an extreme temperature and oxygen ions a “lower” temperature is based on the EUV “colors” of these species. Thus, the different oxygen colors generated by different layers in the Aurora Borealis suggest different oxygen temperatures. Conclusion, the Aurora Borealis has layers with distinct temperatures.
The analogy with Aurora Borealis: It is a credible that the hypothesis that oxygen ions are found in cooler region of the Purple Haze (e.g. near earth) and the iron in a different region (e.g. heliopause). Clearly, (Box 1) the heliosphere is far from uniform in composition and temperature. Given the vastness of some of the identified heliosphere “regions” it is highly unlikely that these regions are homogenous. There are likely may sub-regions within each region. Moreover, the entire heliosphere is associated with the complex magnetic field of the sun. It is plausible that different ions (oxygen vs. iron) are captured within different regions of this magnetic field.
Another interesting analogy with the Aurora Borealis. The light associated with the Aurora is not associated with an object. It is light generated in a low-density media, just as the PHP assumes EUV is generated in low density media.
Point 4
One final data set supporting the Purple Haze Hypothesis: data collected by mass spectrometers aboard spacecraft well away from the earth’s atmosphere clearly show highly ionized iron is found in significant quantities within the solar system (Fig. PN-2). The observed temperature “spread” of the ions is remarkably broad, and the distribution of ion types varies from location to location and time to time.

Figure PN-2.
Finally, it must be noted the PHH is only a hypothesis; it is far from established. Presently it is somewhere between science and metaphysics. Tests need to be devised to challenge it. Possible tests include random examination of ISM, stars and even Inter-Galactic Media, with precisely the same instrumentation. Only virtually identical spectra in the EUV from all points examined would be consistent with the PHP. Another test: create a low-pressure terrestrial plasma with hydrogen and a catalytic species (e.g. H2/He) as well some volatile iron species. Do the lines shorter than 30.4 nm disappear? Do highly ionized iron ion spectra appear?
Final-Final
The data employed in support of the PHH were de-stove piped. Several distinct data sets were employed, none citing the others. A broad consideration of ALL relevant data leads to more complete consideration of a problem and can lead to interesting (?) hypotheses for further testing. Conclusion: long past time for the scientific community to teach the next generation to avoid hyper-specialization.
Two: Epiphany
From Meriam-Webster:

A scientific epiphany is defined by the third meaning of epiphany given above; or at least my personal experience is consistent with that definition. For example, I studied the “catalytic etching” of metals in the lab, and in the literature, intensely for over a year…UNTIL in a single moment I knew, without doubt, that metal etching is the result of a chemical reaction between homogeneously formed radicals, and the solid phase metal. This was an entirely new idea. After that moment I spent years with further testing and articulating this model of catalytic etching. (It even led me to study plasmas. Some of Randy’s earliest knowledge of plasmas comes from this source…) The etching epiphany remains validated (T.C.Wei, and J. Phillips, “Thermal and Catalytic Etching: Mechanisms of Metal Catalyst Reconstruction,” (Book chapter) Advances in Catalysis, 41:359-421 (1996)).
Another personal example: again, after several years of study of the structure of bimetallic particles I understood the dynamic nature of the various phase transformations, how these depended on the underlying support, AND how to test all the concepts experimentally. One moment I did not know this, and the next I did. And, after years of experimental testing/verification my bimetallic morphology and chemistry epiphany stood thoroughly validated. (J. Phillips, J. Weigle, M. Herskowitz and S. Kogan, “Metal Particle Structure: Contrasting the Influences of Carbons and Refractory Oxides.” Applied Catalysis A: General, 173:273-287 (1998).)
I feel the PHP is another such epiphany. Years of testing will be required.
And I must wonder about the experience of Randy and the key to GUTCP, the orbitsphere. Did the structure of the orbitsphere come to him in a single inspired moment?
Can AI have epiphanies?
R. Mills, Y. Lu, and K. Akhtar, “Spectroscopic observation of helium-ion- and hydrogen-catalyzed hydrino transitions,” Open Physics 8(3), 318–339 (2010).
R. Mills and P. Ray, “Extreme ultraviolet spectroscopy of helium–hydrogen plasma,” J. Phys. D: Appl. Phys. 36(13), 1535–1542 (2003).
R. Mills and P. Ray, “Spectral emission of fractional quantum energy levels of atomic hydrogen from a helium–hydrogen plasma and the implications for dark matter,” International Journal of Hydrogen Energy 27(3), 301–322 (2002).
S.E. Labov, and S. Bowyer, “Spectral Observations of the Extreme Ultraviolet Background,” The Astrophysical Journal 371, 810 (1991).
R.L. Mills, P. Ray, B. Dhandapani, M. Nansteel, X. Chen, and J. He, “New power source from fractional quantum energy levels of atomic hydrogen that surpasses internal combustion,” Journal of Molecular Structure 643(1–3), 43–54 (2002).
R. Mills, J. Lotoski, and Y. Lu, “Mechanism of soft x-ray continuum radiation from low-energy pinch discharges of hydrogen and ultra-low field ignition of solid fuels,” Plasma Sci. Technol. 19(9), 095001 (2017).
A.F. H. van Gessel, “EUV Spectroscopy of Hydrogen Plasmas,” M.S. Thesis (2009) (https://research.tue.nl/en/studentTheses/euv-spectroscopy-of-hydrogen-plasmas)
E.M. Reeves, M.C.E. Huber, and J.G. Timothy, “Extreme uv spectroheliometer on the Apollo Telescope Mount,” Appl. Opt. 16(4), 837 (1977).
G. Del Zanna, S.R. Wieman, V. Andretta, and L. Didkovsky, “The EUV spectrum of the Sun: SOHO, SEM, and CDS irradiances,” A&A 581, A25 (2015).
J. Phillips, C.C. Luhrs, and M. Richard, “Review: Engineering Particles Using the Aerosol-Through-Plasma Method,” IEEE Trans. Plasma Sci. 37(6), 726–739 (2009).
T.-C. Wei, L.R. Collins, and J. Phillips, “Dynamics of charged species in the afterglow region of a low-pressure microwave plasma,” J. Phys. D: Appl. Phys. 28(2), 295–304 (1995).
T. Wei, L.R. Collins, and J. Phillips, “Measurement and modeling of N‐atom behavior in the afterglow of a microwave plasma,” AIChE Journal 42(5), 1361–1370 (1996).
J. Phillips, C. H. Chou, and T. C. Wei, “Materials modification by energetic atoms and ions,” Proc. Mater. Res. Soc. Symp. 268, 49 (1992).
C.-H. Chou, T.-C. Wei, and J. Phillips, “Detailed model of the afterglow region of a microwave generated oxygen plasma,” Journal of Applied Physics 72(3), 870–878 (1992).
C.-K. Chen, T.-C. Wei, L.R. Collins, and J. Phillips, “Modelling the discharge region of a microwave generated hydrogen plasma,” J. Phys. D: Appl. Phys. 32(6), 688–698 (1999).
N. Craig, M. Abbott, D. Finley, H. Jessop, S.B. Howell, M. Mathioudakis, J. Sommers, J.V. Vallerga, and R.F. Malina, “The Extreme Ultraviolet Explorer Stellar Spectral Atlas,” Astrophys J Suppl S 113(1), 131–193 (1997).
R. Rocchia, M. Arnaud, C. Blondel, C. Cheron, J.C. Christy, R. Rothenflug, H.W. Schnopper, and J.P. Delvaille, “Spectral observations of the soft X-ray background with solid-state detectors - Evidence for line emissions,” Astronomy and Astrophysics 130, 53–61 (1984).