


The Hydrino Hypothesis Chapter 10
An Introduction To The Grand Unified Theory Of Classical Physics

This monograph is an introduction to Randell L. Mills’ Grand Unified Theory of Classical Physics, Hydrino science, and the efforts of the company Brilliant Light Power (BLP) to commercialize Hydrino-based power technology, as told by Professor Jonathan Phillips. Out of necessity, it assumes a degree of familiarity with physics and physics history. An overview of the BLP story which serves as a helpful introductory piece to those unfamiliar with its sweeping scope can be found here. Readers should also read the previous chapters of this monograph prior to this one:
Chapter 1 of The Hydrino Hypothesis
Chapter 2 of The Hydrino Hypothesis
Chapter 3 of The Hydrino Hypothesis
Chapter 4 of The Hydrino Hypothesis
Chapter 5 of The Hydrino Hypothesis
Chapter 6 of The Hydrino Hypothesis
Chapter 7 of The Hydrino Hypothesis
Chapter 8 of The Hydrino Hypothesis
Chapter 9 of The Hydrino Hypothesis
By Professor Jonathan Phillips
Experimental Evidence For Hydrino: Excess Heat Observations Using Calorimetry
Preface: This chapter is a detailed discussion of another experimental method employed to try and debunk the Hydrino Hypothesis: calorimetry. This approach is consistent with the Theory of Science stated repeatedly in this monograph: theories cannot be proved, only disproved/debunked/falsified. Calorimetric study results repeatedly show heat greater than unity, that is, more heat out than heat in with no conventional chemical explanation. That is, calorimetric experiments failed to debunk HH, hence the theory remains valid.
Introduction
The objective of BLP is commercial sale of energy generated by the formation of Hydrinos. Where is that process now? Before October 2023, BLP reported an advanced prototype for commercial power generation using Hydrino formation was on track for reveal! However, we await formal third-party validation that the SunCell is capable of high gain, high absolute power output operation for extended periods. Certainly, a perusal of videos available on the BLP web site, as well as other information available there, suggests extreme power density has already been demonstrated in early versions of the SunCell, with far more Energy Out than Energy In.
In fact, the company has claimed measuring Energy Out/Energy In ratio greater than 10 over many minutes. That is, the company reports far over unity energy output. Over unity: if 10 W is input to run a reactor, over unity means more than 10 W (e.g. 11+ W) is produced by the reactor.
The most recent video of the SunCell in operation as of December 2024 can be seen here:
As discussed in detail below, these claims are supported conceptually by reliable calorimetric measures of excess energy. To wit: There are three types of systems shown in open literature to produce excess energy (over unity) from systems predicted by the HH to create Hydrinos.
Type I: Calorimetry employing gas phase or solid catalysts in standard chemical reactors. Heat input was generally from a furnace, and output was measured with Calvet or water bath calorimeters. Energy Out vs. Energy In was generally based on comparisons with control studies.
Type II: The Hydrino forming reaction was conducted in a plasma. Energy Out/Energy In ratios were determined by direct determination of both input and output energy. Energy In (electric) was determined by the electric energy supplied, and Energy Out (heat) by a calorimeter.
TYPE III: In these experiments electric ignition “explosion” systems were employed. These gave rise to short lived plasmas. The Energy In (electrical pulse) was measured on the basis of current and voltage determination, and the Energy Out (heat) was studied with bomb calorimeters.
For Type I, as discussed below, and reported in the scientific literature, an Energy Out/Energy In ratio on the order of 1.1 for periods of more than one hour was repeatedly observed.
Type II generally produced an Energy Out/Energy In ratio of about 1.5 X, again over prolonged periods of time.
Type III results were the most exciting: Energy Out/Energy In ratios as great as 7 were reported.
In all cases control studies, that is calorimetric studies of Energy Out/Energy In ratios generated from mixtures not predicted to produce Hydrinos by the HH, never produced excess energy signals.
In sum, reliable, over unity energy production, obtained using a variety of calorimetric strategies from mixtures predicted by the HH to lead to Hydrino formation, were reported in very established scientific journals.
All calorimetric and supporting results are consistent with the Hydrino Hypothesis!
The demonstration of over unity energy production does not of itself lead to successful commercial applications. As discussed in detail below, there have been a number of scientifically accepted demonstrations of significant excess energy production consistent with the predictions of the HH, that is, energy production consistent with that expected from Hydrino formation. Yet, neither the magnitude nor the duration reported in the scientific literature is sufficient to support commercial application. Indeed, the reader is urged to consider if the results of over unity energy production found in the peer reviewed scientific journals match the requirements of commercialization, reviewed below.
Long periods of significant over unity energy production. Later it will be argued that 3X+ energy gain recorded for many hours is a minimum viable level for a commercial energy production device.
Control of the incredible power density of the Hydrino reaction.
Effective engineering packages able to harvest the energy associated with Hydrino formation.
System longevity; capable of operating for months.
In addition to the peer reviewed publications demonstrating significant energy gain, BLP recently reported a power in/heat out ratio for a SunCell prototype of greater than 30 for a brief period, although this experiment was not formally published.
Continuous Energy Production Consistent with the HH: Pre-2013
Calorimetry is the key to demonstration of over unity energy production. With proper experimental protocol it can be a powerful demonstration that the predictions of the HH are consistent with observation. Specifically, the tests of over unity energy production must include the following:
Certifiable, precise, measurement of the input power. In the case of the BLP technology the input power is generally electric (more below), so a very precise measure of input wattage is required.
A precision, calibrated, calorimeter to measure output power. In the case of early versions of the BLP technology (more below) the output power has been heat, and the calorimetric studies have thus been designed to measure heat energy out.
Multiple repetitions, with very similar outcomes, supported by analysis showing that over unity measurements are statistically valid.
Control studies showing that in the absence of Hydrino formation, there is no excess heat.
TYPE I: Early Unpublished Studies
Very early in the BLP saga, back in the age when the company name was HydroCatalysis Power (HCP), a number of “heated gas phase” calorimetry in reactors containing solid H2 dissociation catalysts efforts were undertaken. All clearly showed that over unity power generation was achieved in systems that the HH predicts would lead to Hydrino production. In other words, even these early studies failed to debunk the HH.
Those studies, performed in the early to mid-1990s, showed consistency with the predictions of HH. They were carried out not only at HCP (now Brilliant Light Power) but also by at least one industrial firm, using electrolysis cells (not reviewed herein) and open to the notion that alternative primary energy sources are possible, and by at least one academic team (Penn State University, led by this author).
Those studies repeatedly showed excess heat production (above baseline calorimeter signal) from mixtures containing hydrogen and a catalytic agent, for example hydrogen and helium, but no excess heat from pure gases such as hydrogen or helium.
Although several types of calorimetry were conducted, herein the only reports regard gases containing hydrogen and a catalytic gas (e.g. helium) passed over a solid catalyst, generally Pt or Pd in highly dispersed form, known to split H2 into 2H. In this fashion an environment predicted to create Hydrinos was created, that is, the gas in the calorimeter reactor vessel contained H atoms and a gas phase Hydrino catalytic species.
The general design of all gas phase calorimetric studies was to create experiments such that a quantifiable difference in calorimetry signal/heat production could be observed between i) control studies, that is, studies of gases not postulated to be catalytic mixtures in GUTCP theory (per Ch. 7), and ii) mixtures (e.g. H2-H/He) predicted by the HH to produce Hydrinos and release energy. Moreover, the experiments were designed such that all alternatives to the formation of Hydrinos as the source of any observed excess energy production could be logically eliminated or at least minimized.
Among the earliest calorimetric studies was gas phase work at Penn State, the example most familiar to this author. It was performed using calorimeters containing arrays of thermocouples sealed in the walls of a cylindrical reaction vessel. Note: the calorimeters employed could not detect/respond to the identity of the gas inside the reaction vessel. Control studies, using different single gases, established this truth.
The point of these early studies was to determine if significant investments of time and money for the study of excess energy production via Hydrino formation were justified. In these initial studies the first step was to flow a single gas (e.g. Helium) into the reaction vessel containing a H atom producing solid catalyst (e.g. commercial Pd/C, a commercial catalyst consisting of nanometer scale Pd particles on carbon, for generating H atoms; not a Hydrino catalyst), held at an elevated temperature, for several hours to establish a “no-Hydrino formation” baseline.
Why Pt or Pd catalysts? Conceptually, some of the H2 would be “split” by the Pt/Pd, a well-known means to generate hydrogen atoms from hydrogen molecules, on the solid catalyst to generate H atoms, some of which would “jump” into the gas phase.123 These atoms would, per the HH, react in the gas phase with He to create Hydrinos.
This was followed by a second step: introduction of a HH-predicted Hydrino-from-H atoms catalytic mixture (e.g. H2/He).
The results were remarkable (shown in Figure 10-1). In every case, the introduction of the Hydrino forming catalytic mixture was accompanied by a rapid jump in the magnitude of the signal (volts) output by the calorimeter. Clearly, the difference between the baseline behavior and the catalytic mixture behavior indicated excess heat production from the catalytic mixture relative to the non-catalytic mixture. This outcome is consistent with the HH.
The jump in signal upon switching to a HH-predicted Hydrino forming catalytic mixture, observed by our team at Penn State (and by HydroCatalysis Power, and at least one industrial group), was quantified to provide the amount of heat “excess” (watts) generated upon the introduction of the catalytic mixture. That is, the calorimeters were calibrated with precise electric heat inputs such that increase in signal (volts) was readily converted to heat production rate (watts). Also, pre- and post-experimental measures of mass in the calorimeter were conducted. If the weight decreased, it would suggest an alternative explanation for the heat observed. Indeed, it would suggest combustion. An increase in weight might suggest some other type, probably not well understood, of heat-producing chemistry.
These studies were not published for a variety of reasons. Industrial tests were conducted by organizations not “in the habit” of publishing scientific or engineering results. In the case of the Penn State results, the team published frequently, but in this case felt the results were too extraordinary to merit publication without more extensive study. The team was confident in the calorimeter (ca. accuracy of heat measurement better than 99%), the demonstration of repeated energy output in excess of 10% greater than the control cases, and nearly certain that no unknown chemical process, rather Hydrino formation, was responsible for the excess heat measured.
Regarding the possibility of unknown chemistry: the hypothesis of alternative reactions generating excess heat after introduction of the HH-predicted catalytic mixtures was debunked by mass balance studies. It was repeatedly found there was virtually no mass lost or gained after many joules of excess energy production. This finding is consistent with the HH, and very hard/impossible to explain using conventional physics and chemistry.
In the final analysis, these earlier calorimetric studies, and associated mass balance measurements, studies designed to debunk the HH, failed. The HH remained valid; moreover, on the basis of these early results, it was clear further catalytic studies, more perfectly designed and conducted, were justified.

Figure 10-1: Early Type I Calorimetric Evidence- Gases were continuously passed over a Pd/C catalyst at 250 C (Pd generates H atoms from H2 molecules) in a custom-made high temperature, cylindrical (~5cm diameter x 10 cm high), Calvet style calorimeter. Control studies (HELIUM, above) led to very small or no increases in signal/heat production. In contrast, in catalytic mixtures such as 2% H2/98% He (HYDROGEN, above) there was remarkably large increase in signal/heat production. The Energy Out/Energy In ratio was repeatedly of the order 1.1, that is excess energy was observed. (Phillips, et al., 1996, unpublished results supplied to HydroCatalysis Power (now Brilliant Light Power))
Type II: Published Plasma, Continuous Energy Production, Calorimetry Studies.
The early Type I calorimetric studies, never definitive, but clearly failing to debunk the HH, inspired the design and pursuit of additional gas phase, continuous energy production, calorimetric studies. In addition, the studies were conducted on catalytic systems for which additional markers (see Ch. 8 and Ch. 9) of Hydrino production already existed.
In these next level studies, all of the required elements (prior section) were present for true scientific credibility to be established. This work, performed more than two decades ago by BLP and collaborators, required nearly two years of review, but was eventually published in a premier journal.4 The results are scientifically sound, have NOT BEEN retracted, and will not be retracted, unlike many cases of reportedly scientifically solid studies by highly ranked academics, recently making the news.567 Indeed, after publication, the flagship paper of calorimetric studies of excess heat due to Hydrino formation was vigorously attacked and successfully defended in the Journal of Applied Physics.89 (See Personal Notes at the end of this chapter for details of the difficulties of publishing in scientific journals results which challenge the standard paradigms.)
Plasma systems were selected for study on the basis of the scientific paradigm (Ch. 2) that the viability of a theory is increased by multiple types of “signal” consistent with it. Indeed, earlier studies of virtually identical plasmas produced signals consistent with the HH, including Balmer line broadening (Ch. 8) and EUV spectral features predicted by the HH (Ch. 9). Moreover, those studies, consistent with best scientific practice, established that Type A plasmas (containing hydrogen and catalyst) produced line broadening and EUV signals consistent with the HH, whereas control plasmas, that is Type B plasmas (no catalyst, and/or no hydrogen), did not.
The concept guiding experimental design was simple: if Type A plasmas produced excess heat, while Type B did not, the calorimetric studies would fail to debunk the HH. In contrast, any other outcome of the calorimetric studies would suggest the HH model fails.
Repeated over unity power from Type A plasmas would not only support the HH model but also would represent a severe challenge to conventional physics. That is, the experiments describe above also contain the potential to debunk conventional physics. Indeed, there is no explanation for over unity energy production, absent chemical reactions, in conventional physics. Furthermore, there is no reasonable candidate for chemical reactions in Type A plasmas.
The outcome, discussed in detail below: the calorimetric experiments on plasmas repeatedly show excess heat from Type A plasmas. For Type B plasmas, Energy Out equaled Energy In. These results clearly fail to debunk the HH.
And the results raise these questions: why is the physics community not scrambling to produce an explanation? If they doubt the results, why not replicate and show the results are wrong? Better to ignore evidence of over unity energy production than admit a challenge to the standard narrative?
Detailed Experimental Design, Type II
Experiments with calorimeters containing plasmas were designed to complement earlier plasma experiments in which line broadening, likely from Step I of Hydrino formation (Ch. 7 and Ch. 8), was observed. The calorimeter designed to hold the plasma cell and measure energy output is shown in Figure 10-2. It is simple and effective.
The energy generated in the plasma chamber is released to the water in the calorimeter bath. The amount of power (integrated to energy) added to the water is measured by the rate of temperature gain in a precise amount of water in the well stirred, thermally insulated, tank.
There are minor amounts of Energy In to the water from non-plasma sources, which must be considered. In particular, a small amount of energy is added from the stirrer, and a small amount from the short section of cable in the water bath. If the input and output gases are not the same temperature, this must be a correction as well. Another correction is for convective heat loss from the water bath to the environment.

Figure 10-2: Calorimeter For Determining Plasma Energy Generation- Note, the plasma is generated in a small waterproof cavity, and said cavity placed in a water bath. The only energy inputs to the system are the Microwave Generator, the Stirrer and a small section of cable. Each energy input was measured with precision. Output energy from the plasma is absorbed by the water, hence watching the water temperature increase, and given the well-known heat capacity of water, yields the output power from the plasma. For the control plasmas the Energy In and the Energy Out were measured to be nearly equal. In contrast, the Hydrino catalyst plasmas, for the same Energy In, had an average boost of about 50%, that is, the Energy Out was as much as 1.5 times greater than the Energy In. (After Ref. 10-4)
According to standard physics the total Energy In to the water should equal to the electrical energy from the microwave generator plus a small amount from the stirrer and the submerged section of cable. It must be noted the amount of power reaching the microwave is less than that leaving the generator. That is, there are losses from the microwave cable before it reaches the calorimeter.
In sum, if the measured heat input to the water (system) equals the input to the calorimeter, then standard physics prevails. If the water temperature rises faster than anticipated based on standard physics, there must be another power source. According to the HH that power source would be the generation of Hydrinos. Observation of “over unity” power, that is, more heat Energy Out than added electrically, would be another failure to debunk the HH.
The energy ins and outs discussed above can be expressed mathematically using a standard energy balance equation (Eq. 10-1), in which the water in the calorimeter is the system. This type of energy balance is taught in virtually every engineering undergraduate curriculum. To wit:


The effective energy balance, after elimination of small terms becomes:

It is notable, as shown in Figure 10-3 and all studies with the calorimeter, that the heat input from the plasma is constant. That is, the temperature increases in a very nearly linear fashion. As the temperature change is proportional to the heat capacity of water, constant in this range, and the amount of heat added:

The assumption of constant heat input is consistent with the observed near linear slope of the temperature curve (Figure 10-3). Also, this reactor is a “plug flow reactor.” Once steady state is achieved, reactors of this type generate products, both chemical and energy, at a constant rate, in accord with the linear slopes observed.
It is also notable that the system was calibrated by adding Q at a constant rate using an electric heater inside the plasma chamber. It was found that the change in temperature was precisely that anticipated from the Eq. 10-3 given the measured N value, and the known, and virtually constant, heat capacity of water over the temperature range measured.

Figure 10-3: Control and RT Plasma Data- A) A typical sequence was to run a control plasma, then a RT plasma. In this case a pure Kr plasma, and follow it, exact same settings, but after flushing, with an RT gas mixture, in this case He + 10% H2. B) Another example of the difference between control and RT plasmas. The control was Kr only (200 mTorr), and the RT was a pure water plasma (200 mTorr). It is quite clear that in both examples the RT plasma heats more quickly than the control, and that in all cases the heat output from the plasma is constant over time. (After 10-4)
More than 50 studies were conducted for the Journal of Applied Physics study, and the results are tabulated below in two tables:

TABLE 10-1: Excess Heat From 500 mTorr RT Plasmas- It is apparent that no control plasma: Kr, Kr/H2, Xe, Xe/H2, CO2, N2, N2/H2, Ar and He generated more than 40 W of Qplasma whereas, all the RT plasmas: He/H2, Ar/H2 and H2O generated >47 W. (From Ref. 10.4)

Table 10-2: Lower Pressure Water Plasma Produces More Heat- Many factors impacted the observed heat produced by RT plasmas including the pressure at which the plasma was operated. Clearly, for water plasmas, operation at a lower pressure, 200 mTorr, yielded higher energy than operation of the same plasma at 500 mTorr (as shown in Table 10-1). In contrast, pressure had no impact on control plasma behavior. (From Ref 10.4)
A summary of observations from this study is provided in Table 10-3. It is also notable that two different statistical tests, a t-test and a Wilcoxon non-parametric test were applied to the data to determine if the observed control plasma power production and the RT plasma power production were statistically distinct data sets. Both types of tests showed unquestionably that there is statistically essentially zero probability, for both Table I and Table II data, that the two sets of data, control and RT, are really the same. For Table 10-1 the mean difference between control and RT plasmas is 18.7 W with a 95% one-sided lower confidence bound of 16.8 W.
To repeat the key result in different words: the proper tests clearly show the non-catalyst containing mixtures and the HH-predicted catalyst mixtures produce two statistically distinct data sets. The latter always generate more heat. That is, statistical analysis shows the experiments were well designed. Moreover, the statistical analysis is in complete agreement with the simple observation that over and over again, the controls produce less than ~40 W and over and over again, the RT plasmas produce > 48 W and generally much more.

Table 10-3: Summary of Calorimetric Studies- In all cases it is clear that the control plasma energy output is consistently about 6% lower than expected based on known input and measured loses. Clearly, there is no evidence of excess energy; rather, we see evidence of heat leakage a bit higher than anticipated. Thus, as expected from standard physics, as well as the HH: no Hydrino formation, no reaction chemistry, hence Energy Out is the same as Energy In. In contrast ALL the RT plasmas have more power and Energy Out than power and Energy In. This is anticipated by the HH as Hydrino formation is expected. This result is alarming to standard physics aficionados.
Finally, it must be noted that excess heat generated from Type A plasmas and not Type B plasmas was reported in an earlier publication, but one containing essentially one data point.10 The positive identification of excess heat in that publication justified the lengthy study (Ref. 10-4) described in detail above.
Commercial Application
Given the plasma systems produce over unity energy, why not commercialize the above plasma systems? Although scientifically it is clearly a major breakthrough to produce over unity energy, the ~150% increase in heat energy generated relative to the electrical energy input is not commercially attractive.
In brief, the problem is one of energy quality. The output energy, heat, is lower quality than the input energy, electricity.
The key to understanding quality is to compare the heat required to produce electricity vs. the electricity required to produce heat. Converting heat energy into electrical energy is generally less than 35% efficient. Thus, a system that returns 150% of the input energy as heat is not a true primary energy source. A true primary energy source is able to be self-supporting and have excess energy remaining to sell. In contrast, electrical energy can be 100% converted to heat.
Following is an example that illustrates the problem. Assume the plasma system requires 100 W of electrical input. To be a true primary energy source, that is, to be “self-powered” and have some remaining energy available for other uses, the output heat power from the plasma must in turn generate 100 W of electrical energy and then some, ca. 5 W.
Well, how much heat energy output is required to be a true primary source, that is to produce more than 100 W of electrical energy? Given the low efficiency of heat-to-electricity, roughly 35%, it is necessary to create at least 300 W of heat to generate 100 W of electrical energy. Why? At 35% efficiency to create the 100 W of electrical energy, and leave 5 W for sale, the system needs to produce 300 W of heat energy. Calorimetry shows the plasma system employed per above can produce ~150 W heat energy for every 100 W of electrical input, far short of the required 300 W. Clearly, the microwave system tested is not commercially viable.
Commercialization considerations also include equipment cost, energy density, fuel costs, system longevity, etc. For these and other reasons, 5W of excess power from a 100 W system is also not attractive. Commercialization probably requires an over-unity gain of at least 4X, which allows for substantial excess power available for sale even after accounting for conversion losses and ongoing input power requirements.
Type I: Unconvincing Published Studies
A number of published calorimetric studies were carried out by BLP scientists in which heat, rather than plasma, was added to initiate the reaction. Electric heaters were employed to input heat energy directly to the reaction chamber. The electric heaters were run such that energy was added at a near constant rate for on the order of one hour. (In contrast to the bomb calorimeter method, described below, this is not a pulse input power method!) Generally, the heating was stopped when the sample chamber reached 450 +/-50 C. In this range of temperature generally an accelerated water temperature rise indicated a reaction (e.g. Hydrino production) was taking place. Once the reaction initiated, heating was no longer necessary.
Energy In and Energy Out are measured in very different manners. The Energy In is simple to determine: integrate the product of voltage and current over time. Precise instrumentation for measuring both is readily available. Energy Out determination requires a more specialized art: deconvolution of the temperature profile of cooling water over time.
Neutral results analysis: from this author’s perspective some of these studies do not provide compelling quantitative evidence of excess heat, primarily because clear comparisons between Energy In and Energy Out were not provided.1112 Rather, a comparison between Energy Out and anticipated Energy Out based on postulated conventional chemistry was featured. That is, this author does not feel calorimetric analysis based on “observed” output energy vs. “anticipated” output energy are compelling.
This author requires absolute empirical evidence that in total, more energy was output than energy input. The evidence must include control results (e.g. no hydrogen, or no catalyst) that show the heat output measuring protocol is well calibrated. To wit: control studies must show the integrated and measured energy input is equal to the measured energy output to within a few percent. Proper control outputs can be compared with the output of cases in which all the elements required for Hydrino formation are present. This allows for a measure of absolute excess heat, without reference to anticipated/possible chemical reactions. Moreover, truly persuasive results should include enough replication of control and non-control experiments that proper statistical analysis is possible.
In sum, the aforementioned studies do not provide either the control studies, nor direct absolute Energy Out vs. Energy In comparisons; hence, these studies neither support nor falsify the HH.
Type I: Better Published Studies
There is at least one calorimetric study of thermally initiated reaction in which the results are clearly consistent with the HH. This study, employing the solid catalysts KNO3 and RbNO3, was conducted using a different calorimeter, specifically a Calvet style calorimeter (Figure 10-4).13 This calorimeter was similar to the high temperature calorimeter system employed to create the data in Figure 10-1, as well as a very similar calorimeter described in more detail elsewhere.14 These catalysts are not discussed in prior chapters, but the ionization energies of these materials match the required integer multiple of 27.2 eV required by the HH for a material to serve as a catalyst for Hydrino generation (see Ch. 7 for catalyst rules).

Figure 10-4: Calvet Calorimeter Cross-section- This is the calorimeter employed in gas phase studies of Hydrino formation using alkali nitrate catalysts. Control experiments demonstrated the voltage measured with the Calvet style calorimeter was a linear function of the power input to the cell. Hence, if the voltage reading with catalyst present was higher than that obtained with the control, it provided a quantitative measure of the excess energy evolved. At a minimum, the observation of consistently higher voltages with catalyst present clearly failed to debunk the HH. As shown in Figure 10-5, it is clearly the case that the system containing the catalyst produced more power than the one with only hydrogen. (From Fig. 3, Ref. 10-9)
Once again, failure to observe HH-predicted signatures for Hydrino production using these solid catalysts, including predicted excess energy, from any one of the techniques employed would imply failure of the HH or, at a more charitable minimum, suggest that the nature of catalysts for Hydrino formation is not as readily predictable as GUTCP suggests. Yet again, as with other debunking tests reviewed in this monograph, all results obtained were consistent with GUTCP predictions; hence, the theory remained viable after these tests, including the postulated required characteristics of Hydrino catalysts.
Absolute excess energy was observed relative to the absolute control (Figure 10-5). Also, the Input and Output Energy tracked nearly perfectly for the control studies, each measured independently.
No conventional physics is consistent with these results. The magnitude of the observed absolute heat for the studies in which the solid catalysts and hydrogen gas were present was on the order of 10% greater than the control studies. It also is nearly identical to the magnitude of excess heat measured in the early unpublished studies (Figure 10-1), also based on a similar convention of heating the reaction chamber. (In all cases plasma systems produced a higher over unity value of excess heat, ca. 1.5X than heated systems, ca. 1.1X.) However, this excess heat magnitude is clearly too low to harness towards commercialization.
Notable was the finding that the production of “excess” energy was observed for many hours (Figure 10-5). After hydrogen was added to a cell containing KNO3, the output energy increased for a few hours then leveled off for 15 hours. Similar studies showed steady power for far longer periods.
(Author’s Note: This author taught Chemical Reactor Design courses for nearly two decades at Penn State, Dept. of Chemical Engineering, hence is qualified to comment on the slight increase in heat output once near steady state is reached. In a reactor with unchanging conditions (plug flow reactor at steady state) the power signal should be constant. The slight upward trend in power with time suggests an autocatalytic situation in which new catalyst is gradually generated by the process. A close reading of Ch. 7 suggests HH theory anticipates a buildup of catalyst with time in the reactor.)

Figure 10-5: Calorimeter Data for KNO3 Catalyst- For the H2 only/control case (blue) the input power perfectly matched the output power. All other factors the same, the system with both H2 and KNO3 catalyst present (orange consistently generated more output power than input power. A slight trend toward increasing deviation with increasing power can be observed by consideration of the linearized dotted orange curve. (From Table 3 of Ref. 10-13)
Also notable was the finding that the production of “excess” energy was observed for many hours (Figure 10-6). After hydrogen was added to a cell containing KNO3, the output energy increased for a few hours then leveled off for 15 hours. Similar studies showed steady power for far longer periods.

Figure 10-6: Calorimeter Signal after H2 Added to a Calorimeter Cell Containing KNO3- As shown, the excess energy observed once both catalyst and hydrogen are present, remains steady and constant for many hours. (After Ref. 10-13, Figure 17)
Consistency Observations
In the same paper, (Ref. 10-13) calorimetry results were supported by spectroscopic characterization of plasmas systems employing the same catalysts. As noted in Ch. 2, if multiple tests are consistent with the predictions of a hypothesis, then the case for the hypothesis is strengthened considerably. Specifically, the following behaviors were observed for the same catalysts employed in the calorimetry work, but in gaseous plasmas:
Balmer series line broadening in a microwave plasma.
Lines corresponding to Hydrino formation in EUV spectra.
Inversion of spectral line intensity.
Excess heat/power.
In contrast, control studies carried out (generally pure hydrogen) in which the catalysts were absent, but the protocols identical in all other respects, no signals anticipated to accompany Hydrino formation were observed.
There was limited Balmer line broadening (Figure 10-7) in plasmas with the same catalysts. This is not evidence that line broadening from Hydrino formation in convection-heated Calvet calorimeters is anticipated in pure hydrogen atmospheres. All evidence supports the postulate that Hydrinos are not generated in pure hydrogen in a simple “heated” environment. One plausible explanation: heat/Hydrino production is proportional to the product:
H atom concentration X catalyst species concentration.
This product, concentration H atoms squared in pure H2, is far lower than the product of H atoms X catalyst species in the catalyst-containing environments of the reported Calvet calorimeters. Why? In the systems with Hydrino catalysts, such as He, the catalyst concentration is of the order 30X that of the H2 concentration. H atom concentrations in pure H2 systems will be orders of magnitude lower. In any event, the Calvet calorimeter data shows no excess heat in the absence of the nitrate catalysts.
In addition, in the study of these catalysts, yet another technique was employed. NMR spectroscopy was applied to some materials anticipated to form Hydrino containing compounds via HH-predicted reaction chemistry.
Why? There is considerable value in considering the positive outcomes of all studies employing the same catalysts. It is unlikely to be a strange coincidence that multiple techniques all produced signals consistent with the HH. Some of this work is very briefly reviewed below.
Line Broadening
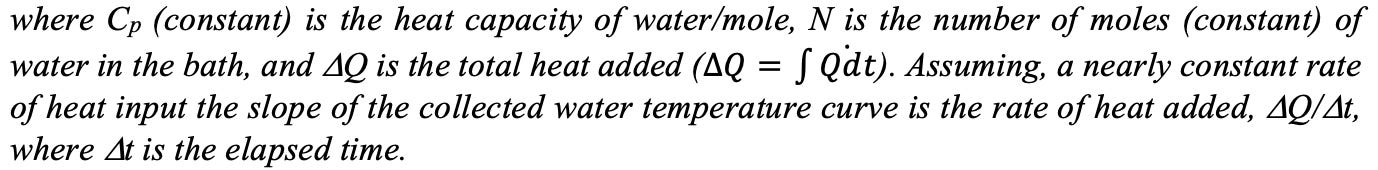
One test consistent with the calorimetric results described above, and the HH prediction that KNO3 and RbNO3 are catalysts for Hydrino formation (Ch. 7), were studies of Balmer series line broadening in microwave plasmas. The system used to study these catalysts was described in prior work with gas phase catalysts (Ref. 10-9). Once again, only in systems containing all required elements, Hydrino catalyst and hydrogen atoms, was Balmer series line broadening observed (Figure 10-7). In control plasmas containing only hydrogen, no line broadening was detected.
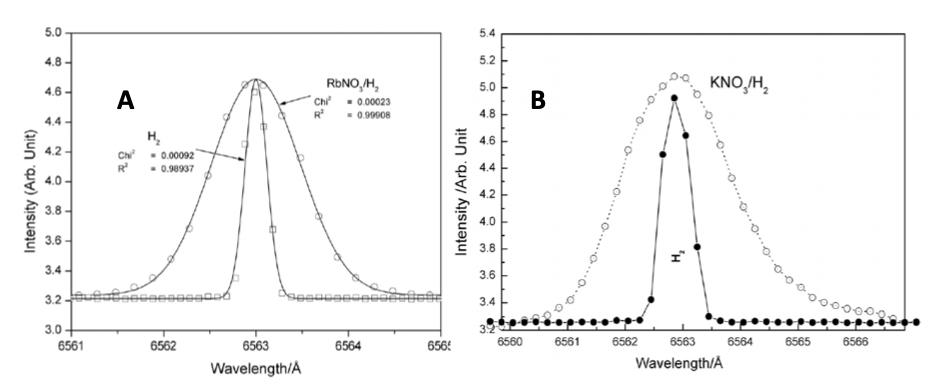
Figure 10-7: Balmer Line Broadening in Microwave Plasmas with Alkali Metal Catalysts- A) Broadening, relative to the control hydrogen gas only system, was observed and equivalent to approximately 12 eV hydrogen atoms. B) Broadening for the system containing KNO3 catalyst was of approximately 18 eV. (After Ref. 10-13, Figures 6 and 7).
It should be noted that the observed broadening was less than that observed with other catalysts, as discussed in Ch. 8. Indeed, for the Rb system the broadening was about 12 eV and for the K system the broadening was about 18 eV.
Population Inversion: another data set consistent with the HH prediction that alkali metal nitrate are catalysts for Hydrino formation is the “inversion” of the populations of excited states in hydrogen atoms. Specifically, the spectral data for H atoms in plasmas containing these catalysts not only shows broadened lines (Figure 10-7), but also relative intensities of the spectral lines that are not anticipated from thermal population (Figure 10-8).
For example, the intensity of the line for transition from the n=4 state to the n=2 state (Hb lines) is significantly greater than the intensity of the line representing transitions from the n=3 state to the n=2 state (Ha lines). This clearly indicates some sort of pumping of higher energy state populations via a mechanism other than thermal equilibration.

Figure 10-8: Inversion of Excited State Populations- Any deviation from the thermal relative population of excited states, such as that shown when the catalysts KNO3 or RbNO3 are present, is very significant and must be explained. (After Ref. 10-13, Fig. 15)
A mechanism of “inversion” of excited state populations, was briefly provided in Ch. 8. To wit: the usual mechanisms for the promotion of electrons into higher and higher energy states reflects increases in temperature, hence lead to gradual increases in the relative populations of higher energy states, but this never leads to population inversion. That is, it is not possible to create, simply by heating, a relative population of hydrogen excited state such that there are more electrons in higher states that lower states.
For example, simple thermodynamics never predicts more electrons in the n=3 state than in the n=2 state. It is unequivocally clear, based on the Boltzmann equation for distribution as a function of temperature, that the higher the excitation energy (the higher the n state, the higher the energy) the lower the expected relative population.15
A thermally equilibrated distribution of occupation of excited energy states is precisely what is observed in those cases in which hydrogen is present but catalytic species are not (Figure 10-7, line A). In contrast (Figure 10-7, lines B and C), the relative population of states when both hydrogen and KNO3 or RbNO3 are present clearly shows the n=3 state has a higher population than the n=2 state.
How can this happen? It can and will happen if there is a process that non-thermally boosts electrons from the n=1 state into a high n-state, or if there is a process that directly boosts a significant fraction of electrons into an ionized state. This non-equilibrium distribution is consistent with the HH, which indicates there should be a superabundance of ionized hydrogen, and concomitantly, the spectroscopy should show a non-Boltzmann distribution of population of excited states. That is, the excited states are occupied by electrons falling from higher energy states, whereas thermal equilibration implies populating excited states via promotion of electrons from lower energy states. In sum, the non-Boltzmann excited state population distribution of Balmer series states in plasma containing catalysts is consistent with the HH, hence fails, again, to debunk the model.
In sum, calorimetric studies of excess heat generated in thermal systems containing alkali metal nitrates are consistent with the HH prediction, and consistent with related plasma studies of Balmer series line broadening and hydrogen excited state population inversion. In contrast, there is no reasonable conventional physics explanation for the calorimetric, or related spectroscopic results. In short, once again the HH predictions are consistent with observation.
Type III: Electronic Ignition Bomb Calorimetry Post 2013
In several peer reviewed publications BLP scientists reported far more Energy Out than Energy In for processes in which electrical energy was employed to “explode” solid mixtures containing both hydrogen and catalyst species, a process labelled Solid Fuel Catalyst Inducted Hydrino Transition (SF-CIHT). In all cases in which catalyst and hydrogen were present, Bomb Calorimetry measurements showed the Output Energy was far greater than the Input Energy (Table 10-4). In contrast, control samples produced no excess energy.
Theory
The underlying postulate is that a high current/low voltage environment ignites an explosive decomposition process. This decomposition creates water molecules, particularly monomolecular water molecules (H-O-H) that act as catalyst for H(1/4) Hydrino formation (Ch. 7).
For example, this general reaction was postulated:16

Where M and M’ are alkaline earth and/or transition metals. Example reactions include i) CuBr2 (M’=Cu and X=Br) paired with Cu(OH)2 and ii) Co(OH)2 paired with CuBr2. Moreover, it was ascertained that in all cases in which water was the catalytic molecule, the final product was generally molecular Hydrino, H2(1/4).
Bomb Calorimetry Experimental Results

Table 10-4: Energy Out Multiples of Energy In- Best results are in Goldilocks zone, see text below. (After Ref. 10-17)17
The measurements shown in Table 10-4 were made with a customized top quality (Parr Instruments) bomb calorimeter, (Figure 10-9). Energy input in the form of low voltage/high current pulses from a spot welding apparatus was always very short duration, on the order of 1 ms. This time frame was not dialed in but rather reflected the impact of the sample explosion. As the current passed directly though the sample, sealed in an aluminum holder in most cases, the explosion created by the high-power input vaporized the sample/sample holder, and/or pushed the electrodes apart, leading to a break in the circuit (open circuit).

Figure 10-9: Customized Bomb Calorimeter- Energy, measured with external amp and volt meters, is generated by a pulse of electric energy transmitted through the electrodes and the sample. This energy quickly (~1 ms) vaporizes the sample, breaking the circuit. Energy released is determined from the temperature profile, measured with a single thermistor, of the water in the stirred bucket below and around the reaction chamber. (From Ref. 10-17)
The Energy In was determined by measurement of the voltage and current:

Where i is the pulse initiation time, cb is the time at which a circuit break stops the energy input, V is the measured voltage as a function of time, and I is the current as a function of time (Figure 10-10).

Figure 10-10: Energy Input Bomb Calorimeter- The low voltage/high current pulse vaporizes the sample and holder, reducing power input to the system to zero in about 1 ms. The vaporization is accompanied by a pressure pulse, as shown in Green and Yellow. (After 10-18)18
This mode of measuring energy input, in the form of a low voltage/high current pulse, is similar to that employed standard bomb calorimetry, although in standard bomb calorimetry current is passed through a fuse wire, rapidly vaporizing it, hence leading to a short pulse of input energy. The energy released by the electric pulse generates heat, and concomitantly generates a very rapid temperature rise, which ignites reaction between compounds in a reagent pan above the fuse wire.
Energy Out in the Hydrino-forming bomb calorimetry work was in the form of heat. Heat output was measured using a methodology identical to the preferred mode of operation of bomb calorimeters. To wit, heat output was measured by the dynamics of temperature change of a relatively large body (Figure 10-9) of water. The stirred water surrounds the reaction chamber, although most of the water is below. The water body is thermally connected to the reaction chamber, but electrically and chemically isolated. Based on decades of experience by a large, international community of scientists, a very detailed protocol is employed to convert the dynamics of water temperature change, measured with a single thermistor (accurate to ~0.001°C) into a highly reliable determination of total output energy due to reaction.
The results of experiments with bomb calorimetry designed to test the HH are found in several publications (Refs. 10-16, 10-17, 10-18), including those in Table 10-4. In all cases excess energy was observed when predicted by the HH and no excess energy was reported from control experiments in which either no catalyst and/or no hydrogen were present.
Of particular note in Table 10-4 are the control studies, and the Goldilocks Zone results.
The control studies show, repeatedly, that in the absence of hydrogen and oxygen containing species the measured heat output matches the heat input within approximately 10%. This is excellent agreement and provides a measure of the uncertainty of all results; moreover, bomb calorimetry is a well-developed technology, and the instrument built and calibrated by a recognized leader in the field.
Thus, measures of “excess heat” which are repeatedly more than 2 times greater than energy input, and as much as 7 times greater than energy input, cannot be dismissed as experimental error.
Supporting Data
Hydrino formation can be controlled to produce energy, very briefly, within the Goldilocks Zone. This is the key finding, as discussed in detail above, relevant to commercial energy production from the bomb calorimeter studies, but it is not the only relevant finding.
Notably, there are two other observations that suggest an extrapolation of the bomb calorimetry approach can be engineered to generate continuous energy at a rate and cost suitable for commercial devices. That is, there are findings that suggest a device based on low voltage/high current, but with constant fuel feed, rather than “single shot” feed (per bomb calorimeter), can be designed to produce energy at a constant rate in the Goldilocks Zone. Indeed, arguably, the reactor chamber of the current SunCell (more below) is based on an extrapolation of the bomb calorimeter reaction chamber.
The first additional significant finding is that continuous fuel feed to a low voltage/high current device produces signals consistent with continuous Hydrino formation. As shown in Figure 10-11, a “silver drip” (hydrated silver flow) into a low voltage/high current reactor creates a UV spectra similar to that of a single hydrated silver shot (Ref. 10-18). It is also notable that whereas a single hydrated silver shot produces a brief flash of light, the continuous flow produces a constant, extremely bright light, as per this video on the BLP YouTube page:
The similarity of spectra and the sustained extreme light production suggest that a Sun Cell, operated with a source of continuous fuel (e.g. hydrated silver), will be source of long duration over-unity energy production.
Figure 10-11: Potential Continuous Operation- The similarity of the EUV spectra produced by a single shot of hydrated silver with that created by a continuous shot suggests continuous operation, and continuous excess energy production, is possible with a low voltage/high current, plasma generating device (After 10-18).
There may be additional energy advantages to the continuous flow method relative to the single shot method. In particular, it is clear, even visually, that the plasma, and UV production, generated by the explosion in the batch calorimeter lasts several milliseconds beyond the end of power input. This in turn suggests the plasma generates catalysts (e.g. monomolecular water), that maintain Hydrino production significantly beyond the end of direct energy input. In turn, this suggests a continuous fuel injection system may create a high steady state population of catalysts, increasing the net rate, reactions/second, of Hydrino formation, and concomitantly energy generation.
Indeed, it is shown (Ref. 10-18, Figure 52) that the brightness of the light generated by the continuous input of hydrated silver continues to dramatically increase for a few hundred milliseconds. It takes time for a steady-state, and maximum power output, to develop. This observation is consistent with a build-up of catalytic species, hence an increased rate of Hydrino production/power generation.
The second significant model support finding (Ref. 10-18) is that most of the energy is released as short wavelength (UV<400 nm) light energy. The energy is not from the “equilibrium glow” associated with temperature, but rather emitted at a far higher energy/shorter wavelength than the temperature of the cell, and the energy level input, would predict. Indeed, as shown in Figure 10-12 the plasma generated is significantly hotter than the surface of the sun. In fact, a rough estimate of the black body temperature of the plasma, based on a comparison of the peak wavelength intensity of the sun (~450 nm) with the peak wavelength observed (~150 nm), and noting T is proportional to 1/wavelength is 18,000 K.

Figure 10-12: Comparison of Bomb Calorimetry Spectra with Solar Spectra. The solar spectra, consistent with a solar surface temperature of 6000 K (TOP), is clearly significantly cooler (longer wavelengths) than the spectra of the plasma formed in the bomb calorimeter. A rough estimate of the bomb calorimeter temperature is 18,000K. (From Ref. 10-18, Figure 31)
Mills et al. point out that the upper energy level of the EUV observed is 10.1 nm, or ~122 eV (left end of EUV spectra shown in Figure 10-12), and argue this represents an output energy level 250 X higher than allowed by the rate of power input. (Physical example of a similar puzzle: turn a wheel in a frictionless fixture with a pulse of power sufficient to turn it at 1 rpm, and then observe the impossible; it rotates at 250 rpm.) It could reasonably be argued that the high energy could be from ordinary chemical processes initiated by the high current/low voltage pulse; however, chemical processes never generate more than a few eV. In short, EUV light is NOT emitted during chemical processes! For example, the adiabatic flame temperature of hydrogen is about 2500 K, which is equivalent to a wavelength of 5760 nm; far, far to the right of the end of the spectra shown in Figure 10-12.
Other observations, such as measured electron energy of order 1 eV (~1250 nm), are not consistent/not in equilibrium with the observation that a significant fraction of the energy is observed in the UV/EUV range. In contrast, the observation of a significant fraction of energy initially releases as UV/EUV is entirely consistent with the HH. That is, if Hydrinos are forming, then the spectra observed would be anticipated.
A plasma need not be hot to emit Hydrinos. As noted in earlier chapters, a plasma containing H atoms and catalysts, even at low temperature, will likely generate Hydrinos. Moreover; the emission even in a relatively low pressure environment from Hydrino formation will reflect absorption/re-emission at longer wavelengths as the mean path of EUV at that pressure is extremely small. Hence, the lack of a spectroscopic signal that precisely matches the predicted Hydrino transition energies/wavelengths is anticipated.
From an engineering perspective, light energy, even if the initial EUV is degraded to longer wavelengths via absorption/re-emission (typical for EUV radiation) can pass through the quartz window, and its energy captured via high efficiency photovoltaic cells, per the current design of the SunCell.
Final Notes on Bomb Calorimetry
One final experimental result is worth noting. Using a gettering device, for example indium foil, the products of the plasma process were captured. Later spectroscopic observation of these products (Ref. 10-18) revealed them to have spectra perfectly consistent with the formation of molecular Hydrino, specifically H2(1/4). Given that water catalysts are predicted to produce H(1/4), and that molecular Hydrino formation from atomic Hydrinos is possibly as likely as H2 formation from H atoms, this is yet another observation entirely consistent with the HH.
At some point this chapter must end; although admittedly only a fraction of the data reported in the literature, particularly the bomb calorimeter series of papers, are reviewed here. Indeed, the bomb calorimeter publications are overwhelming for the amount of material covered. For example, Ref. 10-18 has 63 figures, and involves at least nine characterization techniques. In general, only a few journal articles (other than reviews) have ten figures, and report three characterization techniques. There is an enormous amount of novel data and methodology presented in the bomb calorimetry papers. For this reason, only a selective review was provided above. A full review would overwhelm the reader with detail, whereas the intent here is to provide a simple and hopefully coherent narrative.
Sun Cell: Author’s Perspective
All statements in this Sun Cell section are solely from the perspective of the author. There was absolutely no consultation with BLP personnel. The position of BLP on these comments is unknown. BLP may argue all of the reasoning and statements in this section are incorrect.
The results in the Goldilocks Zone are particularly auspicious for the development of commercially viable energy from Hydrino formation via the current generation SunCell. As discussed in the Commercial Application section (above) heat generation must be a minimum of 3X the input electric energy for any net energy production/sale. This rule applies to any energy generation device that inputs electric energy and outputs heat energy.
There is also a practical energy maximum. Too much heat generation can lead to a “melt down.” Prior versions of the SunCell relied upon a metal containment dome in which the Hydrino reaction occurred. All metals suitable for construction of the reaction chambers of these prototype SunCells have varying maximum operating temperature limits. For example, Ti has a melting temperature of 1,668 C, and all steels at less than 1,400 C. Thus, it is not surprising that too much energy production can lead to rapid melt down of the metal reactor shell, as shown in several videos found on the BLP YouTube page.
Clearly, a successful commercial/Sun Cell must be designed with two limits to Energy Output. First, it must generate more than the minimum required, and, second, it must not produce so much energy that it self-destructs. The Goldilocks Zone marked on Table 10-4 represents the energy production zone that is above 3X of input, yet no more than 7X input. It is the author’s contention that energy production in this zone could yield commercially viable excess energy, but not at an output power level so intense that the device self-destructs.
The above suggested limits to an operational Goldilocks zone are not intended to be absolute. In particular, the upper energy production limit can potentially be extended by clever design. For example, the present Sun Cell design (Figure 10-13) includes a large, transparent, quartz window. This allows for enhanced radiative energy loss, which routes around the problem of temperature buildup in the prior SunCell prototypes with metal containment domes. Future SunCell designs may include novel means of removing energy quickly such that very high gain (e.g. >10:1) energy production rates can be sustained.
Indeed, at the anticipated operation temperatures (>1000 C) radiative loss (~temperature to the fourth power) can be the primary mechanism for “cooling,” that is rapid radiation release, via the large surface area of the transparent dome. Better cooling/energy harvesting leads to a lower steady state operating temperature and enables the transfer of large amounts of energy out of the SunCell without melting the containment dome.
In the absence of the large window, radiative cooling becomes insignificant until near the melting temperature of the metal of the shell, meaning conduction and diffusion will be the primary cooling mechanisms. Those mechanisms release too little power for adequate cooling. Net result: the metal shell prototype SunCell steady state operating temperature, even at minimum commercial viability (Energy Out>3X Energy In), will be above the safe maximum, that is, the system will literally melt.
However, the large window surface area of the transparent dome in the latest iteration of the SunCell is permissive of large radiative energy transfer and thus should allow long duration operation at commercially viable energy gain levels without reactor meltdown.

Figure 10-11: Current Generation Sun Cell. (From our Brilliant Light Power overview article)
Summary
No evidence was found in any study that falsified the HH. Conversely, as predicted, excess energy was repeatedly observed using a variety of calorimeters, catalysts and conditions. The HH remains valid after many calorimetric and support studies.
Three types of calorimetry were employed to test for the existence of over unity energy production. All three repeatedly generated evidence of absolute over unity energy production. The most scientifically complete were the tests run with Type II calorimetry, water bath calorimetry of plasma generated RT systems. Statistical analysis of multiple runs unequivocally indicated absolute over unity energy production from RT plasmas, whereas control plasmas produced no excess energy as determined using absolute or statistical means. Unfortunately, the over unity values from both Type I and Type II studies were not sufficient for commercialization. Indeed, the Type II studies only produced an over unity value of 1.5X, whereas for commercial development, 3X+ gain (Energy Out 3 times greater than Energy In) is required.
Type III studies, based on electric ignition generated absolute over unity values as great as 7X. This is definitely in the range required for commercial application; however, Type III calorimetry was based on extremely small batch testing.
There is strong evidence that the methodology of electric ignition used in the Type III studies can be extrapolated to continuous fuel feed. Indeed, the current commercial design of the SunCell is based on this finding. Stay tuned, remain optimistic.
An Aside
Many aficionados of novel forms of energy production are probably aware that “excess energy,” presumably from fusion, has been measured at the National Ignition Facility (NIF) located within Livermore National Lab. Unfortunately, this does not mean commercial levels of energy from fusion will be produced with this facility, or any other fusion facility. To wit, for every ~100 units of energy used (estimate provided by ex-colleagues) to power the NIF, one unit actually reaches the fusion target. The fusion target then produces, at best, 2X the energy which reaches it. In sum, one puts in 100 units of energy and obtains 2 units of fusion energy, and only for a tiny fraction of a second. This is not a basis for betting on commercial fusion energy being viable in the near future. Hydrino-based energy is a far, far, better bet at present.
Personal Notes
The Nature of Editors
The more correct the “misinformation” in my manuscripts regarding studies on the topic of Hydrinos/GUTCP, the more likely I would hear negative news from journal editors.
For example, I rapidly learned not to even submit manuscripts that bore some relationship with the GUTCP to the super-major, most influential, mainstream journals Science and Nature. The editors of those journals invariably demurred from even sending the manuscripts for review. Instead of hearing from these journals regarding the initiation/outcome of the review process, per normal submission to journal protocol, I would get form letters from some sub-editor about the mismatch between the submitted work and the current focus of the journal. As they explained, given that the manuscripts were doomed to rejection, it was unfair to ask reviewers to waste their time.
Not only were the manuscripts rejected, but I also proudly received some of these rejections in record (?) time; ca. under three hours by e-mail! That is less time than it took to prepare the manuscript for submission, as submission requires matching the manuscript and figures to the required format, providing requested ancillary info, etc. I figured the editors never got past the title or the abstract before bringing out the big REJECT stamp. Those journals appear to have an allergic reaction to anything GUTCP, and most certainly anything claiming to present evidence consistent with the theory. (At the end of the next chapter, I provide a story about another scientist surprised to receive similar treatment for a GUTCP-related submission to Nature.)
Journal of Applied Physics
One route to getting a proper review is to develop a relationship with a publication. One of the relationships I developed early in my career was with the Journal of Applied Physics; hence, I decided to submit the calorimetry paper to that journal. I assume it was because of this developed relationship that the calorimetry paper slipped into the normal review channels. Initially.
And then, the process became extraordinary. Really? The paper was accepted for review in November 2002 and accepted for publication in June 2004. In other words it was in review for 19 months. The review process took about 6X the normal time. And the number of reviewers was also extraordinary; before the process was over 9 reviewers AND the chief editor of the journal carefully reviewed the paper.
Ordinarily, two, sometimes three, reviews suffice; moreover, the Journal of Applied Physics publishes an enormous number of papers, >4000/year at the time, and generally sub-editors assigned to particular topics take on the cumbersome front-line task of organizing the review. Currently there is one editor-in-chief, three deputy editors and 14 associate editors. I would be surprised if the editor-in-chief is directly involved in even a half dozen papers a year.
What was the outcome of this very unusual review process? We received an enormous amount of questions/criticism, and my recollection is that it was from reviewers with a fundamentally sound understanding of both the scientific process and the calorimetric technique. We were able to respond appropriately to all their criticisms, without the need to return to the laboratory and perform additional experiments. In other words, there were no fundamental objections, no objections to the logic, and in the end no objections suggesting that the authors were in any fashion exaggerating the outcome of the work.
The very last part of the review process was most extraordinary: I was called by the chief editor on the phone! I’d never previously been called on the phone by any editor. Yes, we had communicated via e-mail in a very professional, but fairly extensive manner, but a phone call?
I was working for Los Alamos National Laboratory at the time, and on that particular day I was at the University of New Mexico, 90 miles south, wearing my Distinguished National Lab Professor hat. Even after getting the call and establishing that the editor-in-chief, was indeed calling, I was surprised by the nature of the inquiry. My initial surmise/hope was that he wanted to congratulate me on passing through all the hurdles or thank me for my patience and professionalism. Instead, the underlying theme of the call seemed to be the editor working out his own internal conflicts, those between performing his function as a scientist properly, vs. the professional harm he was likely to suffer as a result of agreeing to publish the paper.
I really didn’t have much to say in a conversation lasting more than an hour, very unusual for someone as voluble as myself. I merely agreed to whatever needed agreement, expressed gratitude for his efforts, and tried to sound sympathetic. We did not discuss anything of substance relative to the paper, as that subject had been about as thoroughly and microscopically vetted as possible in the prior 19 months. Was the editor concerned about losing his position as editor? Needed to vent? (A more self-flattering proposition: the editor wanted to be able to say, after the universal acceptance of GUTCP: “I had a long conversation with one of the earliest proponents.”) In any event, the paper was accepted shortly after the call, then quickly published, and this editor did not step down from his editorship until 2014, about ten years later. Clearly, he did not suffer significant professional harm from approving the paper for publication.
But, the story did not end there. After responding professionally to nine highly qualified, and professional, reviewers and the editor-in-chief of a major journal, I was asked to respond to a letter-to-the-editor from someone with no record of experience with calorimetry, but someone clearly already alarmed about the GUTCP and HH because of his familiarity with Balmer line broadening studies, and the failure of such results to debunk the GUTCP.
There is always someone, I have discovered, anxious to act as self-appointed guardian of the current paradigm.
Below, the part of the letter-to-the-editor (A.V. Phelps, “Comment on “Water bath calorimetric study of excess heat generation in resonant transfer plasmas,” J. Appl. Phys 96, 3095 (2004)) relevant to the only topic covered, calorimetry, in the J. Appl. Phys. Paper is reproduced. (NOTE: The component of this letter-to-the-editor focused on critiquing line broadening studies, the majority of the letter, are discussed earlier in the monograph, Ch. 8. Yes, two topics in one letter!)
However, we claim that because of the absence of documented calibrations for the microwave and calorimeter power measurements, the authors are unable to experimentally determine whether the difference in the heating for the non-RT and the RT gases represents energy generation in the RT gases or, for example, greater undetected power loss from the calorimeter for the non-RT gases than for the RT gases. As an indication of the sensitivity to microwave power calibration errors, we note that changes of only +10% of full scale in the tabulated forward power and -10% of full scale in tabulated reflected power would make the delivered power equal to that measured by the calorimeter for the RT gases, rather than that for the non-RT gases. We conclude that to test the RT theory of Mills, these experiments require independent calibrations of the microwave power measurements and of the electrical power to the calorimeter resistor of better than +/- 5% accuracy. Furthermore, …. does not report searches for power dissipated outside the calorimeter and cables, or the changes in spatial distribution, etc., of the discharges for various gases within Tables I or II.
In sum, our antagonist suggested there need be more calibrations of something (?) because the water bath, and/or the electric systems may be aware of the identity of the gases used to generate the plasma. No mechanism for this proposed anthropomorphic knowledge of the system is postulated. For example, by what mechanism does the water bath have knowledge of the gases generating the plasma? How could there be “greater undetected power loss from the calorimeter for the non-RT gases than for the RT gases?” How could “spatial distribution, etc., of the discharges for various gases” effect the heating of a water bath as the entire plasma is submerged in that bath? Maxwell’s Demon? Gremlins? Remarkably, none of the ten qualified reviewers thought of these possibilities, only our antagonist. Is it valid science to deny observations that are not conforming to the preferred narrative?
It is important to note that the system was thoroughly calibrated, both using electric heat input, and via non-RT, that is, control gas plasmas. The results of the latter are clear in Table I, above. The former was described as follows in the published paper:
The water bath calorimeter described previously was calibrated using a precision electrical resistor circuit [Watlow 25A65A2X, powered with a Xantrex dc power supply (0–1200) ±0.01 W] permanently installed within the water tight cavity surrounding the Evenson cavity couple (Figs. 1 and 2). Repeated calibration experiments were conducted at 25–100 W inputs which essentially measured the system heat capacity. The calibration procedure resulted in a linear change in temperature for constant power inputs. This is expected given the nearly constant heat capacity of water over small changes in temperature (<3 K in all cases). Thus, changes in enthalpy can be readily equated with change in temperature of the bath (see the following section). In short, …. one must only multiply the calibration constant by the rate of change of bath temperature to obtain the plasma’s heating power of the water bath. The heat capacity was found, as expected, to be independent of the power input, and the precision of the measurement was found to be ±0.5%. It should be noted that the temperature rise of the 45 l, distilled-water bath (always linear, see Fig. 3) was measured both with a mercury thermometer with a resolution of 0.05 K, and a linear-response thermistor probe (Omega OL-703) with a precision of ±0.001 K. Both measures provided absolute calibration (heat capacity Cp) constants … within 2% of that calculated on the basis of the mass of water in the bath and the amount of glass and metal in the Evenson cavity cage and quartz discharge tube. As the latter values are estimates, the calibrated values were used.
The level of detail included provided in the manuscript, as well as the obvious nature of the protocols, gave real reviewers the confidence needed to accept the paper.
Below is part of the published Response to the Critique as published in the Journal of Applied Physics:
Below we respond to … concerns raised in the Comment.
(i) Regarding diode calibration: Using the best scientific practice, we calibrated the power diodes using a water bath method similar to that developed for the same purpose by NIST. Using ten different “control gas” plasmas (e.g.,Kr, Kr/H2, CO2), the factory calibration of the diodes for the “one operating point” employed exclusively in our experiments was found to agree with our results to within 10%. More importantly, these studies established the “precision” of the system as a whole. We repeatedly (over a period of months and several operators) hit the same operating power within 2.5 W, no matter what control gas mixture was present.
(ii) It is suggested that energy loss dramatically increases in the presence of non-RT gas plasmas. No suggestion is made in the Comment for the identity of the physical process that increases the losses for all ten control gases by 20+ W, a loss far greater than the sum of all the other loss terms, and then selectively disappears for all the RT mixtures. The system behavior, as described in the Comment, is arguably anthropomorphic.
(iii) Regarding the odd “10% of the scale” argument: In all systems in which there is a question about “repeatability” or “spread” in the data, statistical approaches must be employed. A statistical analysis of the data, as clearly argued in the paper, shows the observed differences between RT and non-RT plasmas (consistently >19 W) are without a doubt statistically significant. Statistical approaches, not ad hoc methods, must be used to evaluate reliability of data.
Is it time to consider new paradigms? Recent modifications of the standard physics theories require neutrinos to both have mass and travel at the speed of light, indicate that greater than 90% of the universe is “dark matter” or “dark energy” of unspecified form and origin, and should soon include a vast modification to virtual particle theory to explain the missing “quantum foam.” The standard physics explanations/criticisms of the outcomes of designed tests of CQM [GUTCP] are hardly compelling.
Yes, it is time to consider new paradigms.
Other Journals
In general, publication of non-paradigm conforming science requires some sort of “work around.” Yes, on occasion (see above), and with a great deal of effort, a major journal will publish material based on the content, without regard to the character. In general, this is not the case. One work around employed by BLP for GUTCP theory papers is to get a real review, and eventually publication, in Physics Essays…

Randy pioneered the use of Physics Essays as the go-to journal for GUTCP theory papers. As noted previously, the big-name journals are clearly uninterested in any challenges to established quantum orthodoxy, so anyone seeking to publish theory contrary to SQM has only one option: “shop around” for a journal that will, at a minimum, provide a review!
It is also clear there are a lot of journals, and shopping for one willing to permit challenges to orthodox positions can be exhausting. Hence, once BLP demonstrated Physics Essay was willing to consider the GUTCP theory, I took the less time-consuming option of following the Randy established path; hence I published all three of my GUTCP-related theory papers in Physics Essays. There is one lingering question: What prompted Randy to select Physics Essays in the first place?
The very first paper I published therein clearly states that the Pauli Exclusion Principle (see Ch. 4) is inconsistent with energy conservation, that is, the PEP is nonsense. An article with that concept as a premise is unlikely to lead to accolades from the physics community. Most likely, most reading the Abstract, and I suppose that was a very small number, would be highly nonplussed, and the vast majority would never read the remainder of the article.
Rejection of the PEP is clearly an idea that is wildly counter narrative. Indeed, the PEP is a main component of the model of all atoms and molecules both in physics and chemistry. How could it possibly be wrong? Physics/Chemistry Prof. reaction: Nut! Dismissed! My own honest point of view: anyone overturning such a fundamental tenet of physics should certainly be awarded the highest accolades…. But, here I am still waiting for even the lowest accolades.
From Physics Essays Statement of Purpose:
Different points of view will be accepted as long as they are logically sound and well balanced in their exposition, until the process of truth searching naturally reaches a stage of a convincing argument in favor of one point of view or the other…
Small journals, like family-owned restaurants, always have unique features. The house specialty of PE is the willingness to consider paradigm challenges, but only if said challenge can be supported by an abstract written in French.
I actually lived in France on a sabbatical from Penn State in ’90-’91 working at the Institut de Recherche sur la Catalysis in Villeurbanne, France. I was flattered to be invited there and to work with Dr. Aline Auroux, one of the world’s foremost experts on Calvet style calorimetry. In fact, I was given a Poste Rouge CNRS, a somewhat prestigious award from the French government that helped pay my expenses.
One consequence of my time there is that I became sufficiently proficient in French that I could read the French newspapers Le Figaro and Le Monde. Unfortunately during that time, the US and allies (including, sort of, France) booted Saddam Hussein out of Kuwait, thus, I was able to read all sorts of concepts unfamiliar to those of us in the US. Consistently, Le Figaro opined the war, was “la guerre pour la Jews” or “la guerre de American Imperialism.” Perhaps in the minds of the editors of Le Figaro the two are interchangeable.
Yet, my written French never rose to the level of writing a scientific abstract in the language; hence I sought the use of Google Translate. Merde! I quickly learned that was not acceptable. Finally, a Quebecois, daughter of a translator, friend and colleague, co-author of published papers, co-inventor on issued patents, first encountered during my time working with Toyota, agreed to help me and we produced some sweet French: le meilleur dan tout le monde. The abstract passed muster!
The last chapter in my interaction with Physics Essays was a phone call from the chief editor called me one afternoon, only the second time a journal editor has phoned. At that moment, I was strolling along the Rio Grande river, just in front of my home at the time in Rio Rancho, NM. The call was ostensibly to congratulate me on the acceptance of the paper. But, I wondered if perhaps, once again, I was being called by an editor insecure about his own legacy after publishing such apostasy.
J.C. Weigle, and J. Phillips, “Modeling hydrogen spillover in dual‐bed catalytic reactors,” AIChE Journal 50(4), 821–828 (2004).
J.C. Weigle, and J. Phillips, “Novel Dual-Bed Reactors: Utilization of Hydrogen Spillover in Reactor Design,” Langmuir 20(4), 1189–1193 (2004).
J.A. Menéndez, L.R. Radovic, B. Xia, and J. Phillips, “Low-Temperature Generation of Basic Carbon Surfaces by Hydrogen Spillover,” J. Phys. Chem. 100(43), 17243–17248 (1996).
J. Phillips, R.L. Mills, and X. Chen, “Water bath calorimetric study of excess heat generation in ‘resonant transfer’ plasmas,” Journal of Applied Physics 96(6), 3095–3102 (2004).
C. Wright, “Anatomy of a Scientific Scandal,” City Journal (2023). (https://www.city-journal.org/article/anatomy-of-a-scientific-scandal)
H. Else, “Dozens of papers co-authored by Nobel Laurate Raise Concerns,” Nature (2022). (https://www.nature.com/articles/d41586-022-03032-9)
H. Thorp, “Opinion: We’re retracting two papers from Stanford’s outgoing president. That’s part of how science should work,” L.A. Times, (2023). ( https://www.latimes.com/opinion/story/2023-08-31/stanford-marc-tessier-lavigne-science-retractions)
A.V. Phelps, “Comment on ‘Water bath calorimetric study of excess heat generation in resonant transfer plasmas’ [J. Appl. Phys. 96, 3095 (2004)],” Journal of Applied Physics 98(6), 066108 (2005).
J. Phillips, “Response to ‘Comment on “Water bath calorimetric study of excess heat generation in resonant transfer plasmas” [J. Appl. Phys.96, 3095 (2004)],’” Journal of Applied Physics 98(6), 066109 (2005).
R.L. Mills, X. Chen, P. Ray, J. He, and B. Dhandapani, “Plasma power source based on a catalytic reaction of atomic hydrogen measured by water bath calorimetry,” Thermochimica Acta 406(1–2), 35–53 (2003).
R. Mills, H. Zea, J. He, and B. Dhandapani, “Water bath calorimetry on a catalytic reaction of atomic hydrogen,” International Journal of Hydrogen Energy 32(17), 4258–4266 (2007).
R.L. Mills, K. Akhtar, G. Zhao, Z. Chang, J. He, X. Hu, and G. Chu, “Commercializable power source using heterogeneous hydrino catalysts,” International Journal of Hydrogen Energy 35(2), 395–419 (2010).
R. Mills, P. Ray, B. Dhandapani, W. Good, P. Jansson, M. Nansteel, J. He, and A. Voigt, “Spectroscopic and NMR identification of novel hydride ions in fractional quantum energy states formed by an exothermic reaction of atomic hydrogen with certain catalysts,” Eur. Phys. J. Appl. Phys. 28(1), 83–104 (2004).
J. Phillips, M.C. Bradford, and M. Klanchar, “A Calorimetric Study of the Mechanism and Thermodynamics of the Lithium Hydride-Water Reaction at Elevated Temperatures,” Energy Fuels 9(4), 569–573 (1995).
P. A. Tipler, Modern Physics, 5th edition, (Worth Publishing, NY 1978).
R. Mills, J. Lotoski, W. Good, and J. He, “Solid fuels that form HOH catalyst,” International Journal of Hydrogen Energy 39(23), 11930–11944 (2014).
R. Mills, and J. Lotoski, “H2O-based solid fuel power source based on the catalysis of H by HOH catalyst,” International Journal of Hydrogen Energy 40(1), 25–37 (2015).
R. Mills, Y. Lu, and R. Frazer, “Power determination and hydrino product characterization of ultra-low field ignition of hydrated silver shots,” Chinese Journal of Physics 56(4), 1667–1717 (2018).
This article is not for the faint hearted nor for those with a life-philosophy of… “My mind is made up… do not confuse me with facts!
Several years ago, I came across Dr.Mills’ Grand Unified Theory of Classical Physics. Also known as the GUTCP.
Over several weeks, I read it. (I even understood some of it.)
I then participated, for close to a year, in an online discussion group.
Sadly, when no product of any sort never emerged, the group atrophied away. 😡
IMNTBHO, BrLP needed/needs to build *just one* product of any sort and get it into customers’ hands.
But… in my 85th year… I despair of this happening.😢
There are several places in the Chapter 10 post where the term Energy In / Energy Out is used to indicate over unity output energy and then a value of greater than one is given. I believe you wanted to use the term Energy Out / Energy In instead. If that's the case, feel free to delete this comment after updating the post.
I really appreciate your efforts to bring light to this topic in a very candid and straight-forward manner.